Friday afternoon arrives. You have twelve SEO clients. Each one needs a monthly report.
The data lives in Search Console, GA4, Google Business Profile, maybe Ahrefs or Semrush, and three separate spreadsheets nobody fully trusts anymore. You export, copy, paste, check dates, rebuild a chart, write a summary, and email it. Then you do it again for the next client.
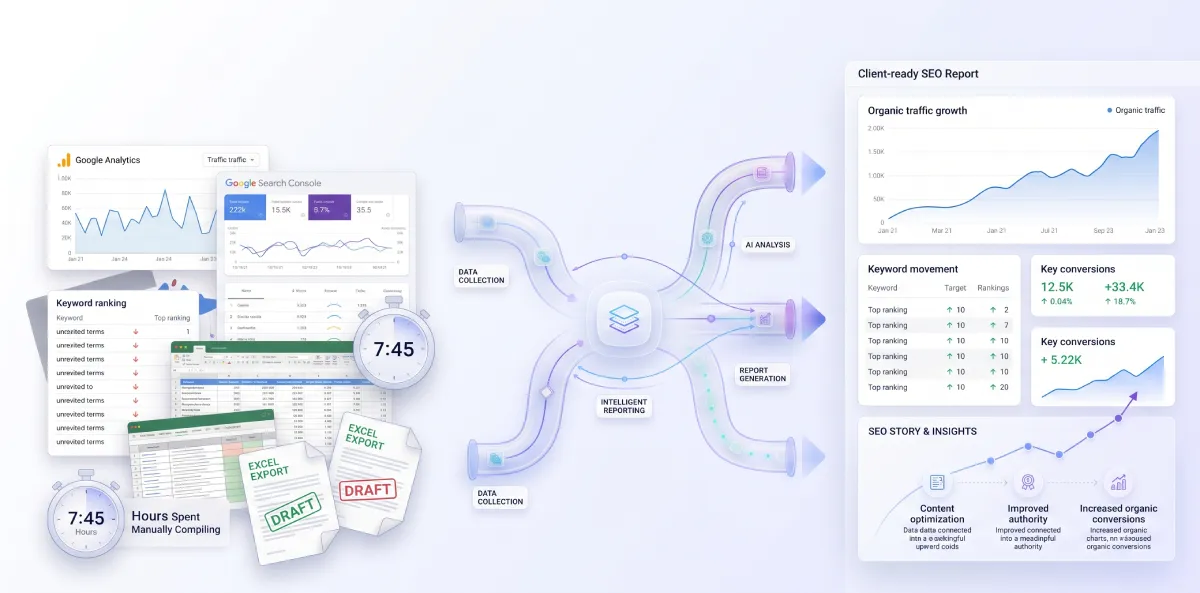
Automated SEO reports fix most of that. A connected system can pull the data, build the report, and send it on schedule. But here’s the part worth getting right from the start: automation should remove the repetitive work, not the interpretation. A dashboard can show that organic traffic went up. Someone still needs to explain why it matters.
What Are Automated SEO Reports?
A manual SEO report means someone opens each platform, exports the numbers, pastes them into a spreadsheet, and formats a document by hand — every reporting cycle, for every client.
An automated SEO report connects those same data sources once. From there, the system collects fresh numbers, builds the report from a fixed template, and delivers it on a schedule without anyone re-exporting anything.
| Manual SEO Reporting | Automated SEO Reporting |
|---|---|
| Data collected manually | Data collected automatically |
| Repeated exports each cycle | Scheduled data collection |
| Manual formatting | Automated dashboards and reports |
| Manual delivery | Scheduled delivery |
| More repetitive work | Less repetitive work |
| More room for copy/paste errors | More consistent workflow, though not error-free |
Automation doesn’t eliminate every error. A broken data connection can produce a wrong number just as easily as a mistyped cell — it just does it on schedule instead of by accident.

Why Agencies Automate SEO Reporting
The trouble isn’t building one report. It’s building the same report, differently timed, for every single client.
One client wants a report on the first Monday of the month. Another wants it on the 15th. A third wants a live weekly dashboard instead of a document at all.
Multiply that by a growing client list, and reporting stops being a small task. It becomes its own part-time job, sitting on top of the actual SEO work.
The math is straightforward. Twenty minutes of manual data collection per client sounds trivial. Across fifteen clients, every month, it adds up to hours nobody budgeted for — hours that come directly out of time that could go toward strategy or client calls.
- Different report dates for different clients
- Inconsistent formats between account managers
- Spreadsheets that need constant maintenance
- Manual data collection repeated across every account
- Reporting time that scales linearly with client count, even when the team doesn’t
Automation addresses the scaling problem specifically. Adding client number twenty shouldn’t cost as much time as client number two did.
It’s worth being clear about what this actually fixes. Automation removes the repetitive collection and formatting steps. It doesn’t remove the need for someone to check the output and decide what’s worth mentioning to the client.
Manual SEO Reports vs Automated SEO Reports
It’s tempting to call automated reporting simply “better.” That’s not quite right. Each approach has real tradeoffs.
| Factor | Manual | Automated |
|---|---|---|
| Setup time | Low, per report | Higher upfront, lower ongoing |
| Data collection | Manual exports | Connected, scheduled |
| Formatting | Rebuilt each cycle | Fixed template, reused |
| Accuracy | Prone to copy/paste errors | Consistent, but depends on connections |
| Consistency | Varies by person | Same structure every time |
| Delivery | Manual email | Scheduled |
| Scalability | Difficult past a handful of clients | Scales with less added effort |
| Customization | Fully flexible, slow | Flexible within the template’s design |
| Analysis | Human, by default | Still needs a human step |
For a one-off audit or a highly custom strategic review, manual work still has a place. For recurring monthly reporting across multiple clients, automation earns its keep quickly.
What Should an Automated SEO Report Include?
More metrics rarely means a better report. The right content depends on the campaign’s actual goal.
Organic traffic
Organic sessions, users, and the landing pages driving them. Look at the trend, not just the current total.
A single month rarely tells the whole story. Three or four months of history make it much easier to tell a real shift from normal week-to-week noise.
Search performance
Impressions, clicks, CTR, and average position from Search Console, broken down by query and page.
This category usually surfaces the first sign of a problem, well before it shows up anywhere else — a drop in impressions often means visibility changed before traffic did.
Keyword performance
Ranking trends grouped by keyword theme. Which terms are climbing, which are declining, and which just became visible for the first time.
Grouping by theme instead of listing every individual keyword makes the pattern easier to spot, especially across accounts with hundreds of tracked terms.
Landing page performance
Traffic, clicks, impressions, and conversions where tracking allows it. Flag pages gaining or losing visibility, not just the top ten by volume.
A page climbing from page two to page one of search results often matters more to future traffic than a page that’s already sitting comfortably at the top.
Technical SEO
Indexing status, crawl issues, Core Web Vitals, structured data errors, and broken pages — where relevant to the campaign.
Not every account needs this section every month. A stable, mature site might only need a technical check quarterly, while a site mid-migration needs it every cycle.
Backlinks
If a backlink tool is connected: referring domains, new links, lost links, and pages sending the most authority.
Skip this section entirely if no backlink tool is connected, rather than filling it with incomplete or unreliable data.
Not every report needs every category above. A report built for a local service business looks different from one built for an ecommerce catalog. Pick what actually answers the client’s question.
Good Report vs Bad Report
- Thirty charts, no explanation
- Every available metric included
- No comparison period
- No priorities or next steps
- Client left to interpret everything alone
- Important KPIs shown first
- Clear comparison period
- Major changes explained in plain language
- Issues prioritized, not just listed
- A short list of next actions
Automation can produce a report on its own. It can’t reliably decide what deserves attention in every situation — that still takes a person who understands the account.
How Automated SEO Reporting Works
Behind a finished report, a few distinct stages happen in sequence.
Data collection. Connected platforms — Search Console, GA4, ad accounts, SEO tools — feed raw data into the system automatically.
Normalization. Different platforms structure data differently. This stage puts it into one consistent format.
Dashboard building. The normalized data fills a fixed report template or dashboard layout.
Validation. Numbers get checked against expectations — is anything obviously broken, missing, or duplicated?
Insight and delivery. A person reviews the output, adds interpretation where needed, and the report goes out on schedule.
How to Automate SEO Reports Step by Step
Define the reporting goal
Is organic traffic growing? Are leads increasing? Which keywords are declining? Start with the question, not the tool.
Choose the data sources
Search Console, GA4, Google Business Profile, Ahrefs, Semrush, Screaming Frog — pick based on the campaign, not habit.
Decide which KPIs matter
More metrics rarely make a report clearer. Pick the handful tied directly to the goal from step one.
Connect the data
Use native integrations or connectors so numbers refresh automatically instead of being exported by hand.
Build the dashboard or report
Structure it so the most important numbers are visible first, with detail available underneath.
Add comparisons
Month over month, year over year, or target versus actual — pick whichever gives the number real context.
Add interpretation
Write a short note on what changed and why, next to the number itself.
Validate the data
Check totals against the native platform before the report ever reaches a client.
Schedule delivery
Set a recurring send date so reports go out consistently, without someone remembering to trigger it manually.
Review and improve
Revisit the KPIs and template every so often. A client’s goals six months from now won’t look identical to today’s.
The Goal → KPI → Action Framework
These are examples, not universal rules — match KPIs to the actual campaign goal in front of you.
| SEO Goal | KPI | What to Watch | Possible Action |
|---|---|---|---|
| Grow organic traffic | Organic sessions | Trend over time | Review winning and losing pages |
| Improve search visibility | Impressions | Search demand shifts | Expand content coverage |
| Improve CTR | CTR | High-impression queries | Review titles and meta descriptions |
| Improve rankings | Average position | Target keywords | Refresh or strengthen content |
| Generate leads | Organic conversions | Conversion trend | Improve landing page experience |
How to Automate Monthly SEO Reports
Collect and validate data
Let connections refresh, then confirm nothing looks broken before moving on.
Review keyword and page changes
Look at what moved, up or down, since last month.
Identify issues and opportunities
Flag anything technical, plus any high-impression, low-CTR opportunities.
Prepare insights and client actions
Turn the findings into a short, specific set of next steps.
Automation handles the repetitive collection and formatting across all four weeks. The review and interpretation still benefit from someone who knows the account.
How to Create Automated SEO Reports for Clients
Agency reporting has different requirements than an internal dashboard. A client checking once a month needs more context, not less.
- Client-specific dashboards: built around that client’s actual goals, not a one-size-fits-all agency template.
- White-label branding: logo, colors, and consistent formatting across every account.
- Scheduled delivery: matched to each client’s preferred cadence and date.
- Client permissions: each client sees their own data only.
- Executive summaries: a short plain-language overview at the top.
- KPI customization: the metrics that matter to this specific business.
- Notes and annotations: a line explaining any unusual spike or dip.
- Historical comparisons: enough context to know if a number is actually good.
A Client Report Example
Example scenario — fictional. Numbers are illustrative only, not real RaiseReturn results.
A digital marketing agency manages SEO for a local service business.
| Metric | Previous Month | Current Month |
|---|---|---|
| Organic clicks | 8,420 | 9,180 |
| Organic impressions | 214,000 | 231,000 |
| Leads | 126 | 139 |
A dashboard shows those three rows automatically. On its own, that’s just data. An SEO professional would go further:
Clicks and impressions both grew roughly 8%, in line with each other — a sign of steady visibility growth rather than a one-off spike. Leads grew slightly faster than clicks, which suggests the added traffic converted at least as well as existing traffic, not worse.
That last point matters more than it might seem. Traffic growth that comes with flat or declining conversions often signals the wrong kind of visibility — more impressions on low-intent queries, for instance. Here, the lead growth rules that concern out for this particular month.
The next step is checking which specific pages or queries drove the impression growth, to see if it’s repeatable next month or tied to a seasonal factor. If it traces back to a handful of service pages, that’s a pattern worth reinforcing with more content in the same area. If it’s spread thin across dozens of low-volume queries, it may just be noise.
What Should You Automate and What Should Stay Human?
| Automate | Keep Human |
|---|---|
| Data collection | Strategic interpretation |
| Data refresh | Client recommendations |
| Chart updates | Explaining unusual changes |
| Scheduled reports | SEO prioritization |
| Recurring calculations | Business context |
| Report delivery | Next-step decisions |
Automate the repetitive work. Keep judgment wherever context actually matters.
Common Problems With Automated SEO Reports
Too many metrics
More data doesn’t automatically mean more clarity. It usually means the opposite — a client scanning thirty numbers will remember none of them.
No context
A number without an explanation just leaves the client guessing whether it’s good or bad. “Clicks: 4,200” says nothing on its own.
Wrong date ranges
Comparing mismatched periods quietly produces numbers that look meaningful but aren’t. A 31-day month compared against a 28-day month will always look like growth, even with flat performance.
Unvalidated data
A broken integration can feed stale or wrong numbers into an otherwise polished report. The report can look completely normal while showing numbers from three months ago.
Vanity metrics
Impressions look impressive. They don’t always connect to a business outcome the client cares about, especially if the queries triggering them have no commercial intent.
No action items
A report that only shows the past leaves the client without a sense of what happens next, which is often the actual question they were hoping the report would answer.
The same report for every client
A single generic template ignores the fact that different campaigns chase different goals — a lead-gen client and an ecommerce client shouldn’t see the same layout.
How to Make Automated SEO Reports More Useful
Start with business outcomes
Lead with what the client actually cares about, not what the connector makes easiest to show.
Keep the first page simple
A short summary works harder than a dense wall of charts.
Show changes, not just totals
A number without a comparison rarely means much on its own.
Highlight important movements
Point out what actually shifted, instead of listing every metric equally.
Explain unusual changes
A spike or dip with no note just invites the client to guess.
Add next actions
Close with what the team is actually doing about the data.
Keep historical context
Trends over several months tell a more honest story than one isolated period.
Customize by client
Adjust the KPIs shown to match each client’s actual goal.
Review the automation regularly
Revisit the template and KPIs periodically — goals change, and reports should too.
SEO Reporting Dashboard Layout
A layout that works for most client dashboards follows a simple top-to-bottom logic.
| Section | What it shows |
|---|---|
| Top row | Organic traffic, clicks, impressions, CTR, leads/conversions |
| Middle | Traffic trend, search visibility trend, top landing pages, top queries |
| Bottom | Losing pages, winning pages, technical issues, recommendations |
This layout works because it moves from the quickest possible summary down to the detail someone would only need if they wanted to dig deeper.
/blog/water-heater-guide
/locations/downtown
“water heater repair cost” Up
“drain cleaning service” Down
Automated SEO Reports for Agencies
The value of automation grows with the number of clients on the books. A single account can be reported on manually without much pain. Twenty accounts cannot — the math from earlier in this guide only gets worse as the roster grows.
- Multiple clients: the same reporting system needs to serve every account without rebuilding it each time.
- Different KPIs per client: a template flexible enough to reflect different goals.
- Recurring schedules: different delivery dates per client, handled automatically.
- White-label branding: consistent presentation across the whole roster.
- Client access: permissions that keep each client’s data separate.
- Centralized dashboards: one place for the team to check every account’s status.
- Historical data: a record the team can reference during renewals or strategy reviews.
- Account management visibility: a manager overseeing several accounts can spot a stalled client faster with one consistent view than by digging through separate spreadsheets.
None of this guarantees faster growth or better retention on its own. It removes friction that otherwise limits how many clients a small team can serve well, which matters most exactly when an agency is trying to grow without proportionally growing headcount.
Automated SEO Reporting Software: What to Evaluate
- Which platforms it actually integrates with
- How fresh the data stays between refreshes
- Dashboard flexibility and customization
- Automated scheduling options
- White-label branding options
- Client access and permission controls
- How much historical data it retains
- Export options (PDF, link, spreadsheet)
- Support for custom KPIs
- How much the report layout can be customized
- Reliability of the underlying connections
- Built-in validation or error checks
- Pricing as the client count grows
- Whether the platform scales with the agency
Automate SEO Reporting With RaiseReturn
RaiseReturn connects Google Search Console, GA4, Google Ads, and Meta Ads into one branded reporting workflow, so agencies aren’t rebuilding client reports by hand every cycle. Explore how the marketing reporting dashboards fit into your existing tools.
Start Your Free Trial →Automated SEO Reports vs SEO Analysis
This distinction matters more than almost anything else in this guide.
Report = what happened. Analysis = why it happened. Recommendation = what to do next. A dashboard reliably automates the first part. The other two still need a person.
“Organic clicks dropped 12%.” That’s data.
“Most of the decline came from three product pages losing impressions.” That’s analysis.
“Review those pages, check what competitors changed, and reassess their search intent alignment.” That’s an action.
Data → Insight → Action. Automation is genuinely strong at the first link in that chain. It’s the other two where an experienced SEO earns their fee.
A Weekly SEO Reporting Workflow
Check major changes
Scan for anything that shifted meaningfully since last week.
Review queries and pages
Look at which search terms and landing pages moved.
Review technical issues
Check indexing, crawl errors, and Core Web Vitals for anything new.
Check conversions
Confirm whether traffic changes are translating into real business outcomes.
Record insights and actions
Write down what changed and what the team plans to do about it.
Data collection across the week can run automatically. The Tuesday and Thursday review steps are where human judgment still earns its place.
Automated SEO Reporting Checklist
- Define reporting goals
- Connect data sources
- Select meaningful KPIs
- Set comparison periods
- Build the dashboard
- Validate the data
- Add interpretation
- Add recommendations
- Apply branding
- Schedule delivery
- Review report quality
- Improve the workflow over time
Frequently Asked Questions
Automated SEO reports solve the part of reporting nobody enjoyed anyway — the exporting, formatting, and re-sending. What they don’t replace is the person who looks at the numbers and knows what actually matters this month. Build the workflow around both, and reporting stops being the thing that eats your Friday afternoon.