White Label Reports Look Great — Until the Data’s Wrong

A client emailed back within twelve minutes of receiving her report. Not to say thanks — to ask why her conversion number had dropped 40% overnight. It hadn’t. A stale connection had quietly fed last month’s numbers into this month’s report, wrapped in the agency’s own logo, sent from the agency’s own domain.

Here’s the part that stings. If that mistake had shown up on some generic third-party dashboard, she’d have shrugged and blamed the software. Instead, it had the agency’s branding on it. So it looked like the agency’s mistake. Which, in a way, it was.

Search “agency reporting software” or “white label reports” and you’ll find the same article, more or less, nineteen different times: a list of tools, ranked by features, with screenshots of pretty dashboards. Almost none of them ask the harder question — what happens the day the branded report is wrong?

What “White Label” Actually Means (Quickly)

Nothing complicated here. A white-labeled report carries your agency’s logo, your colors, sometimes your own domain, with no visible trace of whatever software actually built it. The client sees you. The vendor stays invisible.

Agency reporting software is the engine behind that report — the thing pulling data from GA4, Google Ads, Search Console, and wherever else, then assembling it into something you can hand a client without embarrassment. White labeling is just the coat of paint on top.

Worth sitting with

Branding doesn’t create trust. It transfers responsibility. The moment a report says “your agency” instead of some vendor’s name, every error on that page becomes your error in the client’s eyes — fair or not.

Why Every Guide Talks About Logos, Not Data

Easy to understand why, honestly. Screenshots of custom-colored dashboards make for good blog images. Comparing connector reliability across nineteen platforms does not. So the content that ranks tends to optimize for what’s easy to show, not what actually determines whether a client stays past renewal.

Meanwhile, the thing that actually breaks agency-client relationships rarely shows up in a features table. It’s a report that goes out three days late. A metric that doesn’t match what the client sees in their own Google Ads account. A chart still showing last quarter because a connection quietly failed weeks ago.

12 min
how fast a client noticed one wrong number in a branded report
1
bad report needed to undo months of a clean track record
0
excuses available once the report carries your own logo
Something an agency owner said, after the fact

“We picked our reporting software almost entirely on how the branded PDF looked. Gorgeous templates, easy logo upload, the works. Took us four months to realize the Google Ads connector dropped silently about once a quarter, and nobody had ever told us.”

White Label Reports Look Great — Until the Data's Wrong

A Generic Error vs. a Branded Error — Not the Same Conversation

Run this comparison in your head for a second. Same mistake, same wrong number, two completely different client reactions depending on whose name is on the page.

Error on an obviously third-party tool
  • Client assumes it’s a software glitch
  • “Their platform’s acting up again”
  • Agency gets the benefit of the doubt
  • Fix it, move on, barely a dent in trust
Same error on a white-labeled report
  • Client assumes the agency made the mistake
  • “Did they even check this before sending it?”
  • No third party to quietly absorb the blame
  • Trust takes a real hit, even after the fix

“Branding raises the stakes on accuracy. It doesn’t lower them.”

What to Actually Check Before Choosing Agency Reporting Software

Branding still matters — nobody’s arguing otherwise. It just belongs second on the list, not first. Here’s a more useful order to work through.

1

How connections actually behave

Ask directly: what happens when a Google Ads or GSC connection breaks? Does the platform flag it, or does it just quietly serve stale numbers until someone notices?

2

Data freshness, in real terms

“Real-time” gets thrown around loosely. Ask what the actual refresh window is, and whether that’s fast enough for the decisions your clients are making.

3

Whether errors are visible before send

A good platform flags a mismatched date range or a dead connection before the report ships — not after a client emails you about it.

4

Actual branding depth

Logo and colors are table stakes now. Custom domain, removed vendor footer, white-labeled email notifications — check how far it really goes.

5

How pricing scales with clients

Some platforms look cheap at five clients and brutal at fifty. Model the cost at your actual roster size, not the entry tier the pricing page leads with.

6

Export formats clients actually want

PDF for some clients, a live link for others, an Excel export for the finance team. Confirm the platform covers what your specific clients expect.

A trap worth naming

A beautiful template says nothing about data reliability. Plenty of platforms nail the design layer and quietly underinvest in the connector layer underneath it — and that’s the part clients never see, until it breaks.

Rolling Out White-Label Reports Without Breaking Trust

Even with solid software, a clumsy rollout can still do damage. A few habits keep the transition from becoming its own small crisis.

1

Audit what’s actually broken in your current process

Before switching anything, list the specific failures — late reports, wrong numbers, inconsistent formatting — you’re actually trying to fix.

2

Test data accuracy before touching the branding

Run the new platform against a client’s real numbers for a full cycle first. Confirm it matches before a single logo gets uploaded.

3

Pilot with one forgiving client

Pick an account with a good relationship and some patience built in. Work out the kinks there before rolling it out agency-wide.

4

Build a quick review step into every cycle

One person glances at every report before it sends, even after automation is fully in place. Thirty seconds, every time, no exceptions.

White-labeled reports built on data you can trust

RaiseReturn connects GA4, Google Ads, Meta Ads, Search Console, and PageSpeed into fully branded reports — with your logo, your domain, and connection checks that flag problems before a client ever sees them.

Start Your Free Trial →

Frequently Asked Questions

What is agency reporting software?
Agency reporting software connects to marketing data sources like Google Analytics, Google Ads, and Search Console, then turns that data into client-ready reports automatically. Instead of an account manager building each report by hand, the software pulls the numbers, applies a template, and generates the document on a schedule.
What does white label reporting mean?
White label reporting means a report carries the agency’s own branding — logo, colors, and sometimes a custom domain — with no visible trace of the software that actually built it. The client sees the agency’s brand, not the vendor behind the scenes.
Is white label reporting worth it for a small agency?
Usually yes, even for a small team. Consistent branding on every report signals professionalism, and it avoids the awkward moment where a client notices a third-party tool’s logo on something they’re paying the agency for. That said, branding should come after confirming the underlying data connections are actually reliable.
What should I check before choosing agency reporting software?
Start with data reliability: how often connections break, how fresh the data is, and whether errors are visible before a report ships. After that, look at branding depth, the number of data sources it connects to, pricing per client, and export formats. Branding matters, but it should never be the first filter.

White label reports were never really about the logo. They’re a bet that your agency’s name can carry the weight of everything on that page. Make sure the data underneath is worth that bet before you brand a single report.

GSC vs Google Ads: The Keyword Overlap Quietly Costing You Money

A skincare brand was paying $3.40 a click for “best vitamin C serum for oily skin.” Their Google Search Console data showed something interesting: they’d held position one for that exact phrase, organically, for four straight months. Nobody on the team had looked.

That’s not a rare mistake. It’s what happens when two Google tools that clearly belong in the same conversation get managed by two people who never talk. One handles Google Ads. The other lives in Google Search Console. Between them sits a pile of overlapping keywords nobody’s checked in months.

This isn’t a “how to link your accounts” tutorial — you can find ten of those already. It’s about what to actually do once the two datasets sit next to each other, and why so few teams ever get there.

What Each Tool Actually Shows You

Quick reset, because it matters for what’s coming. Google Search Console tracks how your site shows up organically — impressions, clicks, average position, the exact queries people typed before landing on a page. All of it, free.

Google Ads tracks something related but separate: what you’re paying for, keyword by keyword, and what those clicks actually cost. Same search engine, same searchers, completely different accounting.

2
teams that usually manage these tools, with almost zero crossover
$0
incremental value from an ad click stealing traffic you’d already get for free
1
shared thing both tools measure — the exact same searcher, typing the exact same query

Here’s the part most guides skip: these two systems were never built to talk to each other. Google’s own linking feature helps, sure. But it hands you a combined report — it doesn’t tell you what to do with it. That part’s still on you.

Why Paid and Organic Keep Living in Separate Reports

Ask most agencies why nobody’s compared their GSC and Google Ads data lately, and you’ll get some version of “we’ve just always run them separately.” Fair enough. It’s how the industry grew up — SEO people learned Search Console, PPC people learned Ads Manager, and the two rarely sat in the same meeting.

Add client structure on top of that. Plenty of businesses hire one agency for SEO and a completely different one for ads. Neither side has login access to the other’s platform, let alone a reason to go looking for overlap.

Something a PPC manager admitted

“Honestly, I’d never opened Search Console for that client. I ran the ad account, someone else ran SEO, and we just… never compared notes. Found out later we’d been bidding on four keywords they already owned organically. Felt pretty dumb about it.”

SEO analytics dashboard used for automated client reporting

When Google Ads Pays for What Search Console Already Gives You Free

Here’s the math nobody runs often enough. Say a keyword sends 400 organic clicks a month, sitting comfortably at position one or two. Meanwhile, an ad targeting that same phrase pulls another 60 clicks at $2.80 each — about $168 a month, every month, forever.

Question worth asking: how many of those 60 paid clicks would’ve landed on the site anyway, just through the organic listing sitting right below the ad? If the honest answer is “most of them,” that $168 isn’t buying new traffic. It’s buying traffic you already had.

The core idea

Overlap isn’t inherently wasteful — it’s wasteful when the ad isn’t earning anything the organic listing wasn’t already delivering. Sometimes running both makes sense. Often, though, nobody’s ever actually checked.

Usually worth pausing or lowering bids
  • Non-brand keyword, position 1–3 organically, for months
  • No competitor bidding on the same term
  • Ad copy says roughly the same thing the organic listing already says
  • Low commercial urgency — informational searches, mostly
Usually worth keeping, overlap or not
  • Your own brand name, with competitors bidding on it
  • High-intent, high-value purchase phrases
  • Limited organic real estate — no featured snippet, no extra listings
  • Seasonal or promotional periods where speed beats patience

“The goal isn’t zero overlap. It’s overlap you can actually justify.”

How to Actually Find the Overlap, Step by Step

None of this requires fancy tooling to get started. A spreadsheet and twenty minutes will get you most of the way there.

1

Pull your top organic queries from Search Console

Performance report, filtered to queries in positions one through three with meaningful impression volume — not every long-tail phrase you’ve ever touched.

2

Export the search terms report from Google Ads

Same date range. This shows the actual queries triggering your ads, not just the keywords you bid on.

3

Cross-reference by exact query

Anywhere the same phrase shows up strong in both reports is a candidate worth a closer look — not an automatic pause.

4

Check who else is bidding

Google’s Auction Insights report tells you if competitors are showing up on the same terms. If they are, that changes the calculation completely.

5

Decide: pause, lower the bid, or leave it alone

Weigh organic strength against competitive pressure and commercial intent. There’s no universal rule here — just a judgment call, made with actual data in front of you.

6

Recheck monthly, not once and forget

Rankings shift. Competitors start bidding. A keyword worth pausing in March might be worth reviving by July.

Don’t overcorrect

Pausing every overlapping keyword on sight is its own mistake. Running both an ad and an organic listing on the same page can grab two spots on the results page instead of one — pure real estate, especially against a competitor who’s only got one shot at that SERP.

When Overlap Isn’t a Problem at All

Brand campaigns are the classic exception. If a competitor bids on your company name, letting your organic listing sit there alone is a gamble — someone else’s ad might grab the click before the searcher ever scrolls to your result.

High-stakes purchase terms deserve the same caution. A single missed conversion on a $2,000 product usually costs more than months of “wasted” ad spend on an overlapping keyword. In cases like that, redundancy isn’t waste. It’s insurance.

Doing This by Hand, Every Month, Gets Old Fast

For a single client, this whole process takes maybe twenty minutes. For an agency running fifteen accounts, that’s five hours a month spent exporting spreadsheets and eyeballing overlapping rows — assuming anyone actually remembers to do it.

Most don’t. It falls off the priority list the second a client fire needs putting out, and overlap analysis quietly turns into something everyone means to get back to.

That’s really where automated reporting earns its keep — not by making the decision for you, but by putting Search Console and Google Ads data side by side automatically, every month, so the comparison actually happens instead of getting skipped again.

See paid and organic side by side, automatically

RaiseReturn pulls Google Search Console and Google Ads into one branded report, alongside GA4, Meta Ads, and PageSpeed — so overlap shows up on its own instead of hiding in two separate exports.

Start Your Free Trial →

Frequently Asked Questions

Should I pause Google Ads keywords I already rank for organically?
Not automatically. If a keyword sends you plenty of free organic clicks and the ad isn’t adding real incremental traffic, pausing or lowering the bid usually makes sense. But brand terms, high-intent purchase phrases, and anything a competitor bids on are often worth keeping, even with a strong organic position.
How do I find keyword overlap between Google Search Console and Google Ads?
Pull your top organic queries from Search Console’s Performance report, then export the search terms report from Google Ads for the same date range. Cross-reference the two lists by exact query. Any keyword showing strong organic position and ad spend at the same time is worth a closer look.
Does linking Google Search Console to Google Ads automatically fix keyword overlap?
No. Linking the two accounts gives you a combined paid-and-organic report inside Google Ads, which makes the overlap easier to see. It doesn’t decide anything for you. Someone still has to review the data and choose which keywords to pause, adjust, or leave alone.
Is it bad to run ads on my own brand name if I already rank number one?
Not necessarily. Brand campaigns often protect against competitors bidding on your name, control the messaging searchers see first, and can capture clicks you’d otherwise lose to a rival’s ad. The overlap only becomes wasteful when there’s no real threat and the ad spend isn’t earning anything the organic listing wasn’t already delivering.

What Is an SEO Report? A Practical Guide to SEO Reporting & Automation

Ask anyone who is actually built one of these for a living, and they will tell you the hard part was never just opening Google Analytics. It’s turning four or five browser tabs of numbers into one story a client will read past the first paragraph.

That’s really the whole job. A report only earns its keep if it answers three things: what changed, why it changed, and what happens next. Everything else — the charts, the logo in the header, the neat little executive summary — is packaging around those three answers.

This piece covers what an SEO report actually is, what belongs in a good one, why building them by hand turns into a monthly grind, and what changes once automation takes over the boring parts — without taking the analyst out of the loop.

What Is an SEO Report?

Here’s the plain version: an SEO report is a document that shows how a site performed in organic search over some stretch of time, usually a month. Traffic, impressions, clicks, keyword positions, maybe backlinks and a handful of technical flags — the exact mix depends on who’s asking and why.

That’s the dictionary answer, though, and dictionaries don’t run agencies. The version that actually matters is this: a report is only worth sending once somebody explains what those numbers mean. A spreadsheet full of percentages doesn’t tell a dentist or a SaaS founder whether their money is working. A person has to say so, in plain English, near the top.

The version worth remembering

A report turns search data into a progress update. Tie the metrics to something the client actually cares about, flag what changed, and leave them knowing what happens next. Skip that last part, and you’ve built a very nice-looking spreadsheet.

SEO report vs. SEO dashboard — people mix these up constantly

A dashboard just sits there, updating on its own. You open it Tuesday morning before a client call, or whenever curiosity strikes, and it shows whatever’s live right now. Nobody’s curated it for you.

A report is a different animal. Somebody looked at that dashboard, decided what actually mattered this month, and wrote it down with a point of view. Think of it this way: a dashboard is for checking in. A report is for making a call.

What Should an SEO Report Include?

No single template covers every campaign — a dentist’s office and a 200-SKU online store aren’t chasing the same numbers, and treating them the same is how reports end up ignored. Still, a handful of sections show up in almost every report worth a client’s time.

3
questions a report has to answer: what changed, why, what’s next
5–7
sections that show up in nearly every report worth reading
0
value in a metric nobody on the client’s side can act on
1

Organic traffic

Sessions or users, moving up or down — compared against last month, or last year if the business has a seasonal pattern worth mentioning.

2

Search visibility

Impressions, clicks, click-through rate, keyword movement — together, they tell you whether the site is showing up more, or quietly fading out of view.

3

The keywords that actually matter

Not two hundred rows nobody will read. The dozen or so queries tied to real business goals, and how they moved.

4

Landing pages

Which pages are pulling their weight, which ones are sliding, and where an hour of optimization work would actually move the needle.

5

Conversions and business outcomes

Wherever tracking allows it, tie organic traffic back to leads, purchases, or sign-ups — this is the section that actually justifies the invoice.

6

What happens next

Close with the actual plan. A client should finish reading knowing exactly what the team is doing next month, and why.

If there’s one rule worth keeping, it’s this: a metric earns its spot because it answers a business question — not because the tool happened to export it.

Why Manual SEO Reporting Takes So Much Time

One report on its own isn’t a huge deal. If things have been fairly quiet, you can probably get it done in twenty minutes or so. The problem is doing that same twenty minutes twelve times, for twelve different clients, all around the same Friday.

And the manual process usually isn’t quite as simple as it sounds. You jump into GA4, then Search Console, then a rank tracker. You export a few CSV files, copy everything into a spreadsheet that’s somehow still running on formulas from years ago, and inevitably end up fixing a chart that has decided to break again. Then there’s the commentary to write, the numbers to check one more time, and finally the report itself has to be put together in a way that actually looks presentable to the client.

None of that is hard, exactly. It’s just a lot of small handoffs — and every handoff is a chance for something to slip. A wrong date range here, a value pasted into the wrong cell there. Small stuff, individually. Add it up across a dozen clients and it stops being small.

Something an account manager told us

“I got pretty good at spotting my own mistakes — mostly because I’d made every single one of them by month three. A date range from the wrong quarter. A chart still showing last client’s numbers because I forgot to refresh it. Nobody catches that stuff at 11 PM on a Friday.”

Manual reporting
  • Log into several platforms, every single cycle
  • Export or copy data by hand, again and again
  • Rebuild spreadsheets and charts that keep drifting
  • Rewrite near-identical commentary for each client
  • Burn time double-checking formatting and date ranges
Automated reporting
  • Connect the data sources once, not every month
  • Pull fresh numbers on whatever schedule you set
  • Fill a report structure that never breaks or drifts
  • Generate a first-draft summary for someone to review
  • Run a quality check before anything reaches a client

“Automation isn’t there to replace the strategist. It’s there to replace the copy-pasting around the strategist.”

What Is Automated Client Reporting, Actually?

Strip away the buzzword, and automated client reporting just means the data sources are wired up once, and the report builds itself from there — nobody’s opening a blank spreadsheet on the first of the month wondering where to start.

In practice: connect the platforms, define what the report should include, set a schedule, and let the system do the assembly. A person still opens it before it goes out. That part doesn’t disappear.

And that’s really the whole point. Automation should erase the repetitive prep work, not the judgment behind it. Someone still has to notice that traffic dipped for a weird reason, or that a competitor just launched a campaign worth mentioning. A system can’t do that part — not yet, anyway.
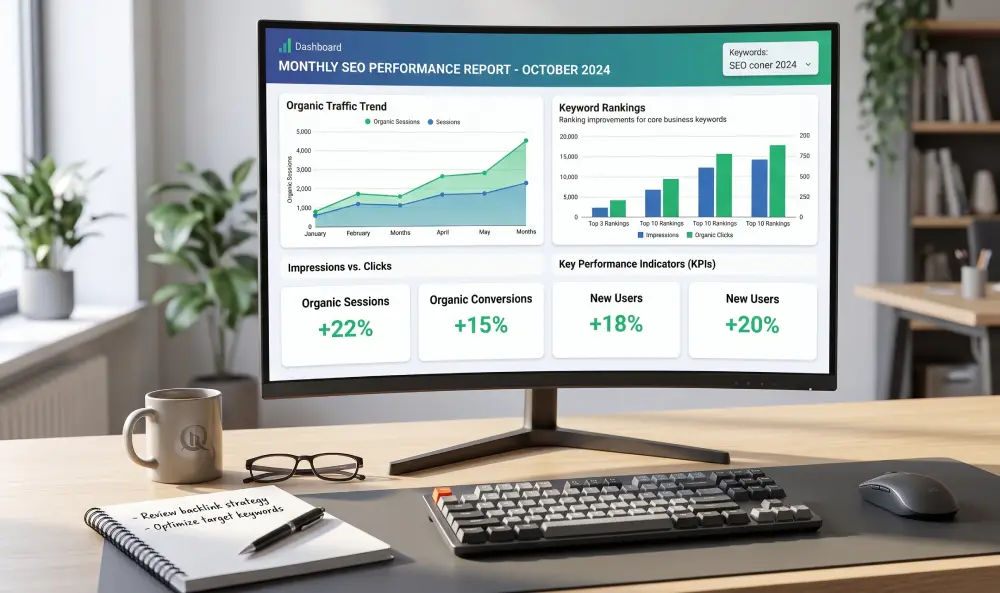
SEO analytics dashboard used for automated client reporting

Wire the data up once, and the report builds itself — leaving the actual thinking for a human.

How to Automate SEO Reporting, Step by Step

Nobody automates their whole workflow overnight, and trying to usually backfires. Pick apart the repetitive steps first, standardize them, then add automation wherever it actually saves real time — not just wherever it sounds impressive on a slide.

1

Figure out what the report actually needs to answer

Start with the client, not the tool. What do they actually want to know? Decide that before touching a single data source.

2

Pick your data sources

Connect whatever holds the numbers you need — GA4, Search Console, ad platforms, a rank tracker. Usually two or three, rarely more.

3

Build one template you’ll actually reuse

Lock in the sections, the branding, the chart styles. The goal is a foundation nobody has to rebuild from scratch next month.

4

Let the system handle the data grunt work

Pulling the latest numbers and running the same calculations every month is exactly the kind of task nobody should be doing by hand in 2026.

5

Add commentary that actually says something

Surface the changes worth mentioning, draft the explanation, then have a person read it before it ships. Skipping that last step is where things go sideways.

6

Run one last check before it leaves the building

Date range right? Data fresh? Anything look weirdly off? Thirty seconds now saves an awkward email from a client later.

Worth remembering

Automation doesn’t fix bad data — it just delivers it faster. A broken connection or a mis-tagged goal will happily produce the same wrong number, right on schedule, every single month, until someone actually checks.

When Should an Agency Bother Automating This?

Not every agency needs this on day one, and that’s fine. But a few warning signs tend to show up long before anyone admits the current process is a problem:

  • Reports eat a genuine chunk of hours, every single cycle
  • The same numbers get copied into three different documents
  • Every account manager’s report looks a little different — and not in a good way
  • Clients have started asking where their report is
  • Reporting keeps stealing time from actual strategy work
  • Signing one more client means signing up for one more manual grind
  • You’ve already sent a report with the wrong month in it, at least once

Recognize two or three of those? The problem probably isn’t that your team needs to move faster. It’s that the process was never built to scale past four or five clients in the first place.

Making the Automated Version Actually Good

Automating a bad report just gets you a bad report faster. A few habits separate reports clients actually open from ones that quietly pile up unread.

Resist the urge to add more metrics

More numbers rarely means a better report — usually the opposite. Pick the handful that actually help someone make a decision, and leave the rest for the dashboard.

Give numbers context, not just a chart

“Traffic went up 12%” means almost nothing by itself. Up from what? Compared to when? Is that normal seasonal noise, or something worth digging into? Say so.

Keep the facts and the opinions separate

Let the data show what happened. Let the commentary explain why it probably happened, and what the team’s doing about it. Blur those two together and clients stop trusting either one.

End with something to actually do

Every report should close with a short, specific list of what’s next. Otherwise it’s just a monthly formality — a document nobody’s waiting for.

Spend less time assembling reports

RaiseReturn connects GA4, Google Ads, Meta Ads, Search Console, and PageSpeed to automate recurring client reporting and produce branded reports with plain-English summaries.

Start Your Free Trial →

Frequently Asked Questions

What is an SEO report?
An SEO report is a document that shows how a website performs in search engines, covering organic traffic, keyword rankings, and technical health. The seo report meaning goes further than raw numbers, though. A useful report explains what those numbers mean for the business, connecting search performance to leads, sales, or whatever goal actually matters to the reader.
What does seo reporting actually involve day to day?
Day to day, seo reporting means pulling data from several platforms, such as Google Analytics, Search Console, and rank tracking tools, then organizing it into a format a client can understand. Done manually, this involves logging into each tool, exporting data, building charts, and writing commentary, often repeated separately for every single client.
What does automated client reporting mean?
Automated client reporting means connecting data sources once through their APIs, then letting a system pull fresh numbers into a fixed, branded template on a set schedule. Instead of manually rebuilding a report every month, the structure stays the same and only the data changes, often with a written summary generated automatically alongside it.
Is automated SEO reporting less accurate than manual reporting?
Not when it is set up correctly. Automated reporting actually reduces a common source of manual errors, like copy-paste mistakes or mismatched date ranges. The main risk is skipping a quality check step, since a broken data connection can quietly feed wrong numbers into a report just as easily as a tired human can type one in wrong.

A good SEO report was never supposed to be a data dump, and it wasn’t supposed to be a box-checking exercise either. At its best, it’s a short, honest answer to one question: is this working, and what’s the plan from here?

For most agencies, the next real upgrade isn’t a new tactic. It’s fixing the reporting process itself — so the time that used to go into copy-pasting spreadsheets goes back into the work that actually moves a client’s numbers.


Why So Many Agency Looker Studio Dashboards Get Built, Then Quietly Abandoned

Ask around at any agency about their Looker Studio dashboard, and you’ll usually get one of two answers. Either they don’t have one, or they built one months ago and haven’t touched it since. Rarely does anyone say it’s working exactly as intended.

That’s not a coincidence. It’s a pattern.

One agency that builds Looker Studio dashboards for a living actually admitted this openly in their own marketing copy — they’ve seen plenty of client dashboards get built, then left to gather dust. Coming from a company selling Looker Studio services, that’s a genuinely striking thing to say out loud. Worth understanding why it happens so often.

The Free Promise, and What It Actually Costs

Google Looker Studio costs nothing to use. That’s the entire pitch, repeated across nearly every guide written about it. Specifically, connect your data sources, build a dashboard, share it with clients — all without a subscription fee attached.

However, “free” only describes the software license. The actual cost shows up somewhere else entirely — in the hours spent building the dashboard correctly, then the hours spent maintaining it every time a connector breaks or a platform updates its API. Consequently, the true price of a Looker Studio dashboard is staff time, and staff time isn’t free at any agency.

A pattern worth recognizing

“We built a genuinely nice Looker Studio dashboard for our biggest client. Took a solid week to get right. Three months later, the Meta connector broke silently. Nobody noticed for two weeks because nobody was checking — everyone assumed it was still working since nobody complained. That’s when I realized we’d built something nobody actually owned.”

1 week
Typical time to build one genuinely polished agency dashboard
2-3 hrs
Monthly maintenance time per dashboard once connectors are live
0
Built-in alerts when a Looker Studio connector silently breaks

The Predictable Lifecycle of an Abandoned Dashboard

Specifically, this pattern repeats itself with remarkable consistency across agencies of every size. Here’s roughly how it plays out, almost every single time.

1
Week 1 — The Enthusiastic Build

Someone gets genuinely excited about it

A team member spends real hours connecting data sources, building charts, applying colors that vaguely match the client’s brand. It looks great. Everyone’s impressed in the demo.

2
Week 2 — The Client Share

The link goes out, the client checks it a couple times

Excitement peaks. The client logs in once, maybe twice. Genuinely appreciates the effort. Nobody yet knows this dashboard has no assigned owner going forward.

3
Month 2 — The First Break

A connector fails, quietly, without warning

An API changes, a permission expires, something stops updating. Looker Studio doesn’t alert anyone. The dashboard keeps displaying stale data as if nothing happened.

4
Month 3+ — Quiet Abandonment

Nobody notices, because nobody’s checking anymore

The client stopped logging in weeks ago. The agency stopped monitoring it entirely. Technically, the dashboard still exists. Functionally, it’s dead — and everyone involved has quietly reverted to manual reports.

Agency Looker Studio dashboard maintenance and reporting workflow for multiple clients

A dashboard built with genuine enthusiasm still needs an owner — and most agencies never assign one.

Why This Cycle Repeats So Consistently

Specifically, the root cause isn’t laziness or bad tooling. It’s ownership. A Looker Studio dashboard is self-managed software, meaning the responsibility for keeping it accurate sits entirely with whoever built it. Furthermore, most agencies never formally assign that ongoing responsibility to anyone specific.

Consequently, the dashboard becomes an orphaned project the moment the person who built it moves on to the next client, the next campaign, the next fire that needs putting out. Nobody decided to abandon it. It just happened, gradually, because nobody’s job description included “watch this dashboard forever.”

“Free software isn’t actually free once you count the hours someone has to spend keeping it alive. That bill just shows up as your own team’s time instead of an invoice.”

What “Free” Actually Costs an Agency at Scale

Specifically, this math gets significantly worse as client count grows. One dashboard is manageable, if barely. Fifteen dashboards, each with its own connectors, its own maintenance needs, its own risk of quietly breaking, becomes a genuine operational burden that scales faster than most agencies expect.

Client Count Monthly Maintenance Time Realistic Outcome
1-2 dashboards2-4 hoursManageable, if someone owns it
5-8 dashboards10-20 hoursStarts competing with billable work
15+ dashboards30+ hoursDashboards begin silently breaking unnoticed

Notice what happens in that bottom row. Past a certain client count, the maintenance burden of “free” Looker Studio dashboards genuinely exceeds what a paid, purpose-built tool would have cost — just paid in staff hours instead of a subscription line item.

The Other Problem — Client-Readiness

Specifically, even a well-maintained Looker Studio dashboard has a second issue that rarely gets discussed openly. One reviewer summed it up bluntly: it’s not meant to be pretty. The default visual style requires real design effort to feel genuinely branded, and even then, dashboards typically show raw numbers without any narrative explaining what they mean.

Consequently, a client staring at a live dashboard still needs someone to interpret it for them — which defeats a chunk of the “self-serve, always-updated” promise that made Looker Studio appealing in the first place. The client gets access to data. They don’t automatically get understanding.

The honest tradeoff worth naming

Looker Studio genuinely excels at flexible, real-time data visualization for teams with the time to build and maintain it properly. Where it struggles is exactly where agencies feel the most pain at scale — ongoing upkeep across many clients, and turning raw numbers into something a non-technical client actually understands without a follow-up call.

What Changes When Reporting Doesn’t Need a Dedicated Owner

Specifically, the alternative to the abandonment cycle isn’t necessarily abandoning Looker Studio’s core idea — live data, pulled automatically, presented clearly. It’s removing the maintenance burden that causes the abandonment in the first place.

A purpose-built reporting tool handles connector maintenance centrally, rather than leaving it to whoever happened to build the original dashboard. Furthermore, it pairs the data with a written explanation of what changed, closing the client-readiness gap that raw dashboards leave open. Nobody has to remember to check whether a connector quietly broke three weeks ago.

What this looks like in practice: Instead of one team member owning a dashboard indefinitely, data connections get managed at the platform level, with automatic error handling built in. Reports generate on schedule, with branding and narrative already applied. Nothing gets abandoned, because nothing depends on one person remembering to maintain it.

Reporting that doesn’t need a dedicated owner

RaiseReturn connects to GA4, Google Ads, Meta Ads, Search Console, and PageSpeed automatically, with built-in maintenance and a written explanation of what changed every month. Fully branded reports in under 60 seconds, no dashboard to babysit. 30-day free trial, no credit card required.

Start Your Free Trial →

Frequently Asked Questions

Why do agencies abandon Looker Studio dashboards?
Agencies typically abandon Looker Studio dashboards because of ongoing maintenance burden — connectors break, data sources drift out of sync, and someone needs to fix the dashboard every time a platform updates its API. Since Looker Studio is self-managed, that upkeep falls on whoever built it, and without dedicated ownership, dashboards quietly stop getting updated.
Is Google Looker Studio actually free for agencies?
The core Looker Studio platform is free to use. However, the real cost for agencies shows up in staff time spent building, maintaining, and troubleshooting dashboards, plus the cost of premium data connectors for some platforms, which often require a paid third-party connector subscription. That ongoing labor cost is usually the deciding factor, not the software price.
Can Looker Studio dashboards be used as client-ready reports?
Looker Studio dashboards can technically be shared with clients, but many agencies find them insufficiently polished for external use without significant customization. The default visual style requires design work to look genuinely branded, and dashboards lack built-in narrative explanations, so clients often need someone to interpret the data for them separately.
What should agencies use instead of Looker Studio for client reporting at scale?
Agencies managing multiple clients often move to purpose-built automated reporting tools that handle data connections, branding, and narrative generation without requiring ongoing dashboard maintenance. These tools trade some of Looker Studio’s customization flexibility for consistency and reduced staff time, which tends to matter more as client count grows.

Free software still costs something. It just charges in hours instead of dollars, and that bill comes due quietly, one broken connector at a time, until a dashboard nobody meant to abandon just stops being useful.

Build it if you’ve got the ownership to sustain it. Otherwise, let something else carry that weight.

What Is an SEO Report? (And How to Spot a Real One vs a Sales Pitch in Disguise)

A business owner opens an unsolicited email. Subject line: “We found 47 critical issues on your website.” Attached, a twelve-page PDF, red icons everywhere, a score of 34 out of 100 stamped across the front. Panic sets in immediately. That reaction is exactly the point.

Here’s the thing nobody tells you upfront.

An SEO report can be two very different documents wearing the same name. One genuinely helps you understand your website. The other exists purely to scare you into a sales call. Both call themselves “SEO reports.” Only one of them deserves your trust.

The Straightforward Definition, First

Strip away everything else, and an SEO report is simply a document showing how a website performs in search engines. Organic traffic, keyword rankings, technical site health — the core metrics that reveal whether search visibility is improving or slipping.

Furthermore, a genuinely useful version of this document does something more specific. It connects those metrics to something the business actually cares about — leads, sales, inquiries — rather than stopping at raw numbers nobody outside SEO fully understands. That connection is what separates a report worth reading from one that just looks impressive.

68%
of business owners say they can’t fully interpret their own SEO report
2 kinds
of “SEO report” circulating — diagnostic tool and sales tactic
1
Real question every good SEO report should answer: is this working?

What a Genuine SEO Report Actually Includes

Specifically, five components separate a report built to inform from one built to fill pages. Here’s what earns a spot in a report someone’s actually meant to use.

1

An executive summary, up top, in plain English

Four sentences, maybe five. What happened, why, what’s next. A stakeholder should understand the month from this alone, before touching a single chart.

2

Organic traffic and ranking trends, with comparison

Not a single snapshot. A trend, shown against last month and ideally against the same period last year, if seasonality matters for the business.

3

Technical health, prioritized and translated

Crawl errors and page speed issues matter, but only the ones affecting real performance. A summarized fix list beats a raw error dump every time.

4

Business outcomes, not just search metrics

Leads generated, conversion rate from organic traffic, revenue where trackable. This is the piece that actually justifies the SEO spend to whoever approves it.

5

Specific next steps, not vague reassurance

“We’ll continue monitoring” isn’t a plan. “We’re fixing three broken redirects and publishing two pages targeting high-intent terms” is one.

SEO report showing organic traffic keyword rankings and business outcomes for a genuine client diagnostic

A genuine SEO report explains what happened and why. A sales-pitch audit just lists everything that could theoretically be wrong.

When “SEO Report” Really Means “Sales Pitch”

Here’s the part almost nobody says plainly. A specific category of “free SEO audit” gets built with a completely different goal — not to inform, but to alarm. These reports scan a site with automated tooling, list every single issue the scanner can find, regardless of actual severity, and package it into something that looks alarming enough to trigger an immediate phone call.

Consequently, a site with genuinely solid SEO can still receive a scary-looking audit. Minor technical notes — a missing alt tag here, an unoptimized image there — get presented with the same visual weight as issues that actually matter. The goal isn’t accuracy. It’s urgency.

Something worth recognizing

“I got one of these unsolicited audits for my site. Forty-something ‘critical’ issues, a score in the 30s, red everywhere. I checked GA4 the same day — my organic traffic had grown 40% over six months. The audit wasn’t lying exactly. It just wasn’t telling me anything that actually mattered.”

Signs of a Sales-Pitch Audit
  • Arrived unsolicited, often via cold email
  • Every issue treated as equally urgent
  • Score or grade dominates the front page
  • No context connecting issues to actual traffic loss
  • Pushes toward a call or purchase immediately
Signs of a Genuine Report
  • Requested, or part of an ongoing relationship
  • Issues prioritized by actual impact
  • Data leads — trends, not a scary grade
  • Explains why each fix matters, in context
  • Ends with specific next steps, not a sales ask

“A long list of flagged issues isn’t proof your site is broken. It’s proof a scanning tool ran. Those are two very different things.”

What Changes Once the Report Becomes a Habit, Not a Pitch

Specifically, the tone shifts entirely once an SEO report moves from first-contact sales tool to ongoing client communication. A monthly report inside a real working relationship doesn’t need to manufacture urgency. It needs to build trust, one consistent update at a time.

Furthermore, that shift changes what belongs in the document. Fewer scary red icons, more trend lines. Less “look how broken this is,” more “here’s what improved and what we’re doing next.” The report stops selling and starts informing — which, honestly, is what the name always should have meant.

The trust test worth applying

Before trusting any SEO report, ask one question: does this document want something from me right now, or is it just telling me what’s happening? Reports built to inform can sit with you for a week without losing value. Reports built to sell lose their power the moment urgency fades — which is usually the biggest tell of all.

Building Reports That Never Need to Manufacture Urgency

Specifically, agencies and in-house teams that report consistently, on a fixed schedule, rarely need alarming language to get attention. The relationship itself creates trust — a client who’s seen five honest monthly reports doesn’t need issue number six to be terrifying to take it seriously.

Consistency does more work here than most people realize. A report that arrives the same day every month, with the same clear structure, builds credibility simply by showing up reliably. Furthermore, when something genuinely does need urgent attention, a consistent reporter’s warning carries real weight — because it’s rare, specific, and earned, not a permanent feature of every single report.

What this looks like done well: A monthly SEO report lands on the same date, every time. It leads with a plain-English summary, shows traffic and ranking trends with context, and closes with two or three specific actions for next month. Nothing manufactured, nothing scary for the sake of scary. Just an honest update — which, over time, builds far more trust than any single dramatic audit ever could.

Build SEO reports people actually trust

RaiseReturn pulls Search Console and GA4 data automatically, filters it down to what matters, and writes the plain-English summary explaining what changed and why. Fully branded, AI-powered reports in under 60 seconds. 30-day free trial, no credit card required.

Start Your Free Trial →

Frequently Asked Questions

What is an SEO report?
An SEO report is a document showing how a website performs in search engines, covering metrics like organic traffic, keyword rankings, and technical site health. A useful SEO report connects those metrics to business outcomes, such as leads or revenue, and explains what changed and why, rather than just listing raw numbers.
Why do some free SEO audits feel alarming?
Free SEO audits are sometimes designed as sales tools rather than genuine diagnostics. They can list every technical issue a scanning tool finds, regardless of severity, to make a website look broken and create urgency to purchase services. Not every flagged issue meaningfully affects rankings or traffic, so a long error list isn’t automatically a sign of a serious problem.
How can you tell a genuine SEO report from a sales pitch?
A genuine SEO report prioritizes issues by actual impact, explains why each one matters in plain language, and connects findings to specific business goals. A sales-pitch audit tends to list every possible issue without prioritization, uses alarming language, and pushes toward an immediate purchase decision rather than a clear understanding of the site’s real performance.
What should a monthly SEO report include for an ongoing client relationship?
An ongoing monthly SEO report should include organic traffic trends with month-over-month comparison, ranking movement for business-relevant keywords, a summary of technical fixes made, and a plain-English explanation connecting the data to what the client actually cares about, like leads or revenue. It should read as an update on progress, not a first-contact sales pitch.

An SEO report, at its best, is one of the clearest windows a business owner gets into whether their marketing investment is working. At its worst, it’s a scare tactic dressed up in charts and red icons.

Learn to spot the difference. Then build the kind nobody needs to be afraid of.

SEO (Search Engine Optimization) Guides Never Mention This — How to Actually Prove It’s Working

Search for “SEO” — search engine optimization, if you want the full name — and you’ll get the same guide over and over. On-page, off-page, technical. Keywords, backlinks, crawlability. Useful stuff, honestly. But almost every single one stops the moment the optimizing is done.

Nobody explains what happens next.

What happens next is the hard part. You’ve done the work. Now someone — a boss, a client, a partner who signed off on the budget — wants to know if it worked. And that question turns out to be a lot harder to answer than the optimization itself ever was.

The Part Every SEO Guide Skips

Every guide on the internet will tell you the three pillars. On-page SEO covers your content and keywords. Technical SEO covers speed, structure, crawlability. Off-page SEO covers backlinks and authority. Learn those three things well enough, and you can rank a website. That much is true.

What none of those guides tell you is how to prove any of it mattered. Rankings moved — okay, but did revenue move? Traffic went up — sure, but is anyone actually converting? SEO is a slow, compounding discipline, and slow compounding results are notoriously hard to explain to someone who wants a straight answer in under thirty seconds.

A familiar situation

“My boss asked me last quarter, ‘so is the SEO working or not?’ I had eleven tabs open. Search Console, GA4, a rank tracker, a spreadsheet with three months of numbers. I couldn’t answer in one sentence. That’s when I realized the problem wasn’t the SEO. It was that I had no simple way to show it.”

3-4
Months typical for organic SEO trends to become statistically clear
71%
of stakeholders say they can’t easily tell if SEO work is paying off
5-7
Metrics that genuinely prove progress, out of dozens available

A Quick Recap of What Optimization Actually Covers

Worth a fast refresher before moving on, since it sets up why proving results is genuinely different work.

On-Page

Content, keywords, meta tags, internal structure — the parts you control directly on your own site.

Technical

Site speed, crawlability, mobile experience — the plumbing that lets search engines actually find and read your pages.

Off-Page

Backlinks, brand mentions, authority signals — the parts you can influence but never fully control.

Get all three right, and rankings tend to follow, eventually. But “eventually” is exactly where most explanations run out. Nobody tells you how long “eventually” actually takes, or how to talk about it while you’re waiting.

SEO results shown through organic traffic and keyword ranking data over time

The optimization work happens in weeks. Proving it worked takes patience, and the right way to show the timeline.

Why the Timeline Trips Everyone Up

Paid ads show results the same day. Turn a campaign on, watch clicks come in by lunchtime. SEO doesn’t work that way, and that mismatch causes more frustration than almost anything else in the discipline.

Here’s roughly how a real SEO timeline unfolds, and why patience matters more than most guides admit.

Weeks 1-2
Changes go live

Content published, technical fixes shipped. Nothing visible yet.

Weeks 3-6
Crawling & indexing

Search engines find and process the changes. Early signals, still noisy.

Weeks 7-12
Rankings settle

Positions start to stabilize. A real trend becomes visible.

Month 4+
Traffic compounds

Organic traffic and conversions reflect the work in a measurable way.

Explain that timeline upfront, clearly, and most of the “is this working?” anxiety disappears before it starts. Skip that conversation, and you’re stuck defending silence for three months with nothing but “trust the process” — which convinces exactly nobody.

“SEO doesn’t fail because the tactics were wrong. It fails to get credit because nobody explained the timeline before the waiting started.”

What Actually Proves SEO Was Worth It

Some metrics genuinely demonstrate progress. Others just look impressive without meaning much. Knowing the difference changes the entire conversation with whoever’s asking.

Weak Proof — Sounds Good, Proves Little
  • Total keywords tracked
  • Raw impression counts with no context
  • Domain authority score alone
  • Number of backlinks acquired
  • Pages indexed as a standalone number
Real Proof — Actually Answers the Question
  • Organic traffic, month-over-month trend
  • Rankings for terms tied to revenue
  • Organic conversions or leads generated
  • Click-through rate improvement on key pages
  • Revenue or pipeline attributed to organic search

The left column isn’t wrong exactly. Those numbers matter to the person doing the SEO work. They just don’t answer the question a stakeholder is actually asking, which is some version of: is this making us money, or getting us closer to making money?

Reporting Is What Turns Optimization Into Proof

Here’s the honest connection almost every SEO guide misses entirely. The optimization work and the proof of that work are two separate skills. You can be excellent at one and genuinely weak at the other — and most people are, simply because nobody taught the second half.

Good SEO reporting does three things at once. It shows the trend, not a single snapshot. It connects rankings and traffic to something the business actually cares about. And it explains, in plain language, why the numbers moved the way they did. Miss any one of those three, and even genuinely strong SEO work reads as invisible or, worse, ineffective.

Why plain language matters more than people think

A stakeholder reading “organic sessions up 23% and keyword rankings improved for eight of twelve priority terms” understands that instantly. The same person staring at a raw Search Console export, full of impressions and average positions with no framing, understands almost nothing. Same data. Completely different outcome, depending entirely on how it gets presented.

Building the Reporting Habit From Day One

The best time to start reporting on SEO progress is before anyone asks for it. Waiting until someone questions the results puts you on defense immediately, explaining a timeline nobody agreed to in advance.

Set expectations early. Share the four-phase timeline before work even begins, so silence in month one doesn’t read as failure. Report monthly, consistently, even when the update is short. And always lead with the trend, not the raw number — “traffic climbed steadily for the third month running” tells a far better story than “traffic was 4,200 this month.”

What this looks like done well: A monthly update, five metrics, one paragraph explaining what moved and why. No jargon left unexplained. A closing line about what’s happening next month. That’s it. Simple, repeated consistently, and it does more to build confidence in SEO work than any single ranking win ever could on its own.

Turn SEO work into reports that actually prove it

RaiseReturn pulls Search Console and GA4 data automatically, filters it down to what matters, and writes the plain-English summary explaining what changed and why. Fully branded, AI-powered reports in under 60 seconds. 30-day free trial, no credit card required.

Start Your Free Trial →

Frequently Asked Questions

What is SEO (search engine optimization)?
SEO, short for search engine optimization, is the practice of improving a website’s content, structure, and technical setup so it ranks higher in search results. It covers three areas: on-page optimization (content and keywords), technical optimization (site speed, crawlability, structure), and off-page optimization (backlinks and authority signals).
Why is it hard to prove SEO is working?
SEO results take weeks or months to show clearly, unlike paid ads which show same-day performance. Rankings fluctuate naturally, traffic has seasonal patterns, and the metrics that matter most to a business, like leads or revenue, sit one step removed from the raw SEO data in Search Console. Without clear reporting that connects rankings and traffic to business outcomes, it’s genuinely difficult to demonstrate progress to someone who isn’t deep in the data themselves.
What metrics actually prove SEO is working?
The metrics that genuinely prove SEO progress are organic traffic trends over time, keyword rankings for terms tied to business goals, organic conversions or leads, and click-through rate improvements for key pages. Vanity metrics like total keywords tracked or raw impressions rarely convince a skeptical stakeholder on their own, since they don’t connect clearly to revenue or growth.
How often should SEO results be reported to a client or manager?
Monthly reporting works best for most SEO engagements, since search rankings need several weeks to show a reliable trend rather than daily noise. A short mid-month update for major changes, like an algorithm shift or a sudden ranking swing, can supplement the monthly report without replacing it.

Every guide on the internet will teach you how to optimize a website. Almost none will teach you how to show that the optimizing actually mattered, which is genuinely the harder half of the job.

Learn the tactics. Then learn to prove they worked. Both halves count.

SEO Automation Handles the Work. Nobody Automated the Explaining.

Search “SEO automation” and you’ll land on the same list every time. Rank trackers. Site audit tools. Keyword research that runs while you sleep. Content briefs generated in seconds. All genuinely useful. None of it addresses what happens after.

After is where things get awkward.

Automation quietly took over half the SEO workflow. Rankings monitored automatically. Audits scheduled and run without anyone clicking a button. Keyword research compressed from a day’s work into a coffee break. But somebody still has to explain what all that automated effort actually did — and that part, weirdly, almost nobody talks about.

What Everyone Agrees SEO Automation Covers

Look at any guide on this topic, and the list barely changes. Rank tracking. Technical audits. Keyword clustering. Content brief generation. Internal linking suggestions. Competitor monitoring. Alert systems that flag a broken link before a human notices.

All of it saves genuine time. A task that once took a junior SEO specialist a full afternoon now runs in the background, unattended. That’s a real shift, and the tools built around it deserve the attention they get. However, every one of those guides stops at the same point — the moment the data gets collected. Nobody follows the thread to what happens once a client or a manager actually asks about it.

A conversation worth noticing

“My client asked why our rankings improved so fast this quarter. I told her honestly — half our audits and keyword tracking now run on automation. She got quiet. Then she asked if that meant we were doing less work. I realized I’d never actually explained what the automation replaced versus what it didn’t.”

83%
of marketers now use AI tools somewhere in their SEO workflow
4%
use them with a genuinely strategic plan, not just reactively
0
Top-ranking guides that cover explaining automated work to clients

Why Automation Creates a Trust Gap Nobody Planned For

Here’s the part that catches teams off guard. Clients, bosses, stakeholders — they don’t automatically celebrate efficiency. Some genuinely worry it means less effort went in, even when the opposite is true. Automation moved the boring parts off a human’s plate. It didn’t remove the thinking. But if nobody says that out loud, silence fills in the blank with suspicion.

Consequently, the SEO teams getting the most credit for automated work aren’t necessarily the ones automating the most. They’re the ones explaining it clearly. Every audit that ran automatically still needed a human to decide which fixes actually mattered. Every keyword cluster still needed judgment about which terms fit the business. That distinction rarely makes it into the final report — and it’s exactly the distinction that earns trust.

SEO automation dashboard showing rank tracking and technical audits alongside client reporting

Automation runs the audits. A person still decides what those audits actually mean for the client’s business.

What Actually Belongs on Autopilot — And What Doesn’t

Not every part of an SEO workflow makes a good automation candidate. Some tasks are pure repetition, perfect for handing off. Others need a human brain attached, no matter how good the tooling gets.

Automate

Rank tracking and technical audits

Repetitive, data-heavy, no creative judgment required. Let the software check daily. Nobody needs to manually pull rankings anymore.

Automate

Data collection for reporting

Pulling numbers from Search Console, GA4, and rank trackers is exactly the kind of tedious task automation exists for. Zero reason a person does this by hand anymore.

Keep Human

Deciding which keywords actually matter

A tool can surface 500 keyword opportunities. Deciding which ten connect to this specific business, this specific quarter, still needs a person who understands the client.

Keep Human

Framing results for the person reading the report

Automation can generate a first draft of a summary. But knowing what this particular client worries about, what language lands, what to lead with — that stays a human judgment call.

Notice the pattern. Anything mechanical, repetitive, or data-heavy — hand it off freely. Anything requiring context about a specific business or person, keep a human in the loop. The mistake isn’t automating too much. It’s automating without ever explaining where the line sits.

“Automation doesn’t replace expertise. It just moves expertise from doing the grunt work to interpreting what the grunt work found.”

The Half of SEO Automation Nobody Built a Guide For

Every existing resource on this topic covers the input side. Automating research, audits, content briefs — the work that happens before anything ships. Almost none cover the output side, the part where results get communicated back to whoever’s paying for the work.

That’s a real gap, and it’s a strange one. SEO reporting is arguably more repetitive than keyword research. Pulling Search Console data, comparing it month over month, writing a summary explaining what moved — that’s exactly the kind of task automation was built to handle. Yet almost every automation conversation stops short of it.

What Every Guide Covers
  • Automated rank tracking
  • Automated technical audits
  • Automated keyword research
  • Automated content briefs
  • Automated competitor monitoring
What Almost Nobody Covers
  • Automating the report that explains it all
  • Turning raw data into plain-English narrative
  • Connecting automated wins to business outcomes
  • Delivering results consistently, on schedule
  • Building client trust in automated processes

That right-hand column is where the actual bottleneck usually lives. Teams automate the research and the audits, then sit down every month and manually build a report explaining what happened — undoing half the time savings they just created upstream.

Closing the Loop — Automating the Explanation Too

This is where SEO automation and reporting automation should meet, but rarely do. A tool that pulls Search Console and GA4 data automatically, filters it down to the metrics that matter, and drafts a plain-English summary explaining what changed closes the exact gap every other guide leaves open.

The workflow looks like this in practice. Automated tools handle rank tracking and audits during the month. At reporting time, a separate automated process pulls that same underlying data, adds month-over-month context, and writes the first draft of the narrative explaining it. A human reviews both — the automated SEO work and the automated report — and adds whatever judgment the situation needs. Nothing gets skipped. Everything gets faster.

Why this matters more than it sounds

Automating the SEO work without automating the explanation just moves the bottleneck downstream. Teams end up with faster research and slower reporting, because the manual report-building process didn’t shrink at all. Closing both loops — the work and the explanation of the work — is what actually frees up the time automation promised in the first place.

What this looks like done well: A monthly report arrives on schedule, built from automatically collected data, with a clear summary of what the automated audits and tracking found. The client reads four sentences and understands the quarter. Nobody wonders if less effort went in — because the report itself demonstrates exactly how much intelligence sits behind the automation.

Automate the SEO reporting, not just the SEO work

RaiseReturn pulls Search Console and GA4 data automatically, filters it down to what matters, and writes the plain-English summary explaining what changed and why. Fully branded, AI-powered reports in under 60 seconds. 30-day free trial, no credit card required.

Start Your Free Trial →

Frequently Asked Questions

What is SEO automation?
SEO automation is the use of software and AI tools to handle repetitive search optimization tasks, like keyword tracking, site audits, content briefs, internal linking suggestions, and rank monitoring, without manual effort for every single task. It lets teams manage more SEO work without adding headcount, freeing people to focus on strategy and editorial judgment instead of repetitive data pulling.
Does SEO automation include reporting on results?
Most SEO automation tools focus on the production side, keyword research, audits, content briefs, and rank tracking, rather than reporting. Explaining what automated SEO work actually achieved, in language a client or manager can understand, usually still requires a separate reporting process or a dedicated reporting tool built specifically for that purpose.
Why do clients get suspicious when SEO work is automated?
Clients often associate automation with reduced effort or lower quality, even when the opposite is true. Without a clear explanation of what automation actually improved and why the underlying strategy still required human judgment, clients can misread efficiency as corner-cutting. Transparent reporting that connects automated tasks to real outcomes prevents this misunderstanding.
What should be automated in SEO and what should stay manual?
Repetitive, data-heavy tasks like rank tracking, technical audits, and keyword research are strong candidates for automation. Strategic decisions, like which keywords to prioritize for a specific business, how to frame results for a client, and creative judgment calls on content, generally benefit from staying in human hands, even when the surrounding data collection is fully automated.

Every SEO automation guide teaches you how to work faster. Almost none teach you how to explain that speed to the person footing the bill — and that gap is exactly where trust either builds or quietly erodes.

Automate the work. Automate the explaining. Do both, and nobody ever has to ask if you’re cutting corners.

What Actually Belongs in an SEO Report (And What’s Just Noise)

Open ten different SEO reports and you’ll find the same problem in nine of them. Too many numbers. Not enough meaning. Impressions, average position, backlinks acquired, crawl stats — a wall of data with nobody explaining what any of it means for the business paying the invoice.

That’s the gap worth closing.

A good SEO report doesn’t need more metrics. It needs fewer, better-chosen ones, explained clearly, tied to something the client actually cares about. Here’s what that looks like in practice — and which reporting tools make it repeatable instead of a monthly scramble.

Why Most SEO Reports Feel Like Homework

SEO produces an enormous amount of trackable data. Keywords, positions, backlinks, crawl errors, page speed scores, click-through rates by query. Every one of those numbers means something to the person doing the work. Almost none of them mean anything, on their own, to the client reading the report.

The instinct when building a report is to include everything. Show the depth of the work. Prove the effort. But depth and clarity pull in opposite directions here. A twelve-page SEO report with forty metrics doesn’t demonstrate expertise — it just demonstrates that nobody edited it down to what matters.

Something a client actually said

“This report shows up every month packed with six pages of keyword tables. Honestly, it leaves me clueless about whether we’re winning or losing. Mostly, I just scroll straight to the bottom hoping to see a green arrow.”

68%
of clients say they don’t fully understand their monthly SEO report
5-7
Metrics that genuinely matter in most SEO reports, out of dozens tracked
Weeks
Typical time for meaningful organic movement, not days

What Genuinely Belongs in an SEO Report

Strip it back to what actually drives a decision or builds confidence, and the list gets short fast. Here’s what earns a place.

1

Organic traffic, with month-over-month comparison

The headline number. Not just sessions — sessions against last month, and ideally against the same month last year if seasonality plays a role. A number without a comparison point tells nobody anything useful.

2

Keyword ranking movement for terms tied to revenue

Not every tracked keyword. The ones that actually connect to business goals — the terms someone types right before they buy something or fill out a form. Ranking on page one for an irrelevant term isn’t a win worth reporting.

3

Top landing pages by organic conversions

Which pages are actually pulling their weight? This answers a question clients ask constantly, whether they say it out loud or not: is this traffic doing anything for my business, or just showing up in a chart?

4

Technical health, summarized not itemized

Crawl errors, page speed, indexing issues — these matter, but a client doesn’t need the raw error log. They need one sentence: “We found and fixed three broken redirects that were blocking search engines from key pages.”

5

A plain-English summary that ties it all together

Four sentences, maximum. What happened, why, what’s next. Everything above this point in the report exists to support the summary — not the other way around.

SEO report showing organic traffic keyword rankings and technical health metrics for client reporting

A focused SEO report answers three questions clearly instead of forty questions vaguely.

What to Cut Without Feeling Guilty About It

Some metrics feel important because they’re easy to pull. That doesn’t mean they belong in front of a client. Here’s the honest split.

Keep — These Earn Their Place
  • Organic traffic with MoM and YoY comparison
  • Rankings for revenue-relevant keywords only
  • Top converting organic landing pages
  • Summarized technical fixes, not raw logs
  • Plain-English executive summary up top
Cut — This Is Just Noise
  • Raw impression counts with no context
  • Total keywords tracked as a standalone stat
  • Every ranking change, including irrelevant terms
  • Full crawl error logs, unedited
  • Backlink counts without quality context

Notice something about that right-hand column? None of it is wrong information. It’s just information without a home. Cutting it doesn’t make the report less thorough — it makes the report actually readable, which is the entire point.

“A client doesn’t want proof you tracked a hundred keywords. They want to know if the ten that matter are moving in the right direction.”

Reporting Tools That Actually Make This Repeatable

Knowing what belongs in a report is one thing. Building that report the same way, every month, without eating an entire afternoon is another problem entirely. This is where the right reporting tools change the math.

Approach Best For Tradeoff
Manual — Search Console exports + spreadsheet1-2 clients, low volumeTime-consuming, inconsistent formatting
Live dashboard toolsData-comfortable clients who self-serveNo narrative, raw numbers need interpretation
Automated reporting tools with AI narrativeAgencies managing multiple clients monthlySetup time upfront, minimal after that

For a freelancer with one or two clients, manual pulls from Search Console still work fine. Past that, the math flips fast. Ten clients, each needing a report built by hand, eats a full week every single month — time that could go toward actual SEO work instead of spreadsheet formatting.

What good automated reporting tools handle for you

Look for three things. First, direct integration with Search Console and GA4, so data pulls automatically instead of via manual export. Second, a way to filter which keywords actually matter, rather than dumping every tracked term into the report. Third — and this saves the most time — AI-generated narrative that reads the numbers and writes the plain-English explanation for you, ready for a quick human review before it goes out.

The real time cost, compared

Building one SEO report manually, from Search Console pull to finished document, typically runs two to three hours. With reporting tools that automate the data collection and draft the narrative, that drops to roughly fifteen minutes of review per client. Multiply that gap across ten or fifteen clients, and the monthly time difference becomes significant fast.

How Often an SEO Report Should Actually Go Out

Monthly is the standard for good reason. Organic search doesn’t move on a weekly clock — rankings shift, settle, shift again, and meaningful trends usually take three to four weeks minimum to separate signal from noise. Reporting weekly on SEO tends to highlight fluctuation rather than progress, which does more harm than good for client confidence.

That said, some agencies layer in a lighter mid-month check-in, particularly around a Google algorithm update or a sudden ranking swing. That’s not a replacement for the full monthly report — it’s a heads-up, a sentence or two, sent proactively before the client has to ask what happened.

What this looks like done well: A client receives a monthly SEO report with five clear metrics, a plain-English summary, and a short “what we’re doing next” section. If something significant shifts mid-month, they get a two-line heads-up before the next report, not radio silence until the 1st. That combination — consistent depth plus proactive flags — builds far more trust than a longer report ever does on its own.

Build SEO reports clients actually understand

RaiseReturn pulls Search Console and GA4 data automatically, filters it down to what matters, and writes the plain-English summary for you. Fully branded, AI-powered reports in under 60 seconds. 30-day free trial, no credit card required.

Start Your Free Trial →

Frequently Asked Questions

What should be included in an SEO report?
A useful SEO report should include organic traffic trends with month-over-month comparison, keyword ranking movement for terms tied to business goals, top landing pages by organic conversions, technical health signals like crawl errors or page speed issues, and a plain-English summary explaining what changed and why. Metrics that don’t connect to a business outcome, like raw impression counts or total keywords tracked, add clutter rather than clarity.
What reporting tools work best for building SEO reports?
The right reporting tools for SEO depend on scale. For a handful of clients, Google Search Console paired with a spreadsheet can work. For agencies managing multiple accounts, dedicated reporting tools that pull Search Console, GA4, and ranking data automatically save significant time and reduce the risk of manual data entry errors slipping into a client-facing report.
How often should an SEO report be sent to clients?
Monthly reporting is standard for most SEO engagements, since organic search results typically take weeks to show meaningful movement. Sending reports more frequently, like weekly, often highlights noise rather than genuine progress. Some agencies supplement monthly reports with a lighter check-in for major algorithm updates or sudden ranking shifts.
Why do clients struggle to understand SEO reports?
Clients often struggle with SEO reports because the metrics get presented without context. A ranking position or impression count means little without an explanation of what changed and why it matters for the business. Reports that translate technical SEO metrics into plain-English business impact are consistently easier for non-technical clients to understand and trust.

An SEO report isn’t a transcript of everything that happened. It’s a translation — turning technical work into something a business owner can read once and actually understand.

Cut the noise. Keep the signal. That’s the whole job.

The Real Objections Agencies Have About Automated Client Reporting

Ask ten agency owners why they haven’t switched to automated client reporting yet, and you’ll hear roughly four answers. Repeated. Over and over. Some of them are fair. A couple, honestly, don’t hold up once you actually poke at them.

Let’s go through them properly. No spin, no “great question!” deflection. Just the real objection, and a real answer — including the one time we admit the skeptics have a point.

Objection One — “What If the Automated Report Gets the Data Wrong?”

“I don’t trust a machine to pull my client’s numbers without a human checking it first.”

Fair worry. Genuinely. Here’s the thing, though: this isn’t really an automation problem. It’s a data problem, and it exists whether a human or a system builds the report.

If a client’s GA4 property has a broken conversion event — duplicated, misfiring, whatever — an automated report will faithfully reproduce that mistake. So will a manual one. The person pulling numbers by hand doesn’t magically catch a tracking bug just because they’re doing the exporting themselves. Most manual reporters never even open GA4’s real-time view to sanity-check anything. They just trust the export.

The actual fix isn’t “keep doing it by hand forever.” It’s verifying conversion events once, properly, during setup — then reviewing each report before it goes out. That review step matters whether the report took five hours to build or five minutes.

Verdict: Fair concern, solvable with proper setup
42%
of first automation setups reveal a tracking issue that existed long before automation
15 min
Time it takes to verify GA4 conversion events properly, once
0
Reports that should skip human review, automated or manual

Objection Two — “Automated Reports Feel Cold and Impersonal”

“My clients pay for a relationship, not a template with their name pasted in.”

This one gets said a lot. And honestly? It would be true — if “automated” meant “unreviewed.” But that’s not how it actually works, or at least not how it should.

Automated client reporting handles the boring part. GA4 exports, formatting, first-draft narrative writing. The account manager still reads it, still adds the thing the client mentioned on last week’s call, still adjusts the tone if the month was rough. What clients experience isn’t a colder report — it’s a more consistent one, because the person reviewing it isn’t exhausted from spending four hours pulling data first.

Weirdly, the “impersonal” objection usually points backwards. Rushed manual reports, written at 11pm because time ran out, tend to feel far more generic than a calm fifteen-minute review of a well-drafted one.

Verdict: Mostly a myth — impersonal comes from rushing, not automating
Marketing agency team discussing automated client reporting concerns and honest answers

Most objections to automated reporting trace back to a fear of losing control — not the technology itself.

Objection Three — “We’re Too Small for This to Matter”

“We only have five clients. Automation feels like something for bigger agencies.”

Backwards, actually. This is the objection where the math genuinely surprises people once they run it.

A five-client agency is often stretched thinner, not less thin, than a fifteen-client agency with a bigger team. If manual GA4 reporting eats four to five hours per client monthly, that’s up to 25 hours a month — a full working week — spent on formatting instead of client strategy, for a small team where every hour is scarce.

Larger agencies sometimes have a person whose whole job is reporting. Smaller ones don’t have that luxury. The person doing the reports is usually also running campaigns, taking client calls, and trying to grow the business. Small teams often have more to gain from automation, not less.

Verdict: Myth — smaller agencies frequently benefit the most

“Every objection to automated reporting has a version that’s fair and a version that’s just fear dressed up as caution. The trick is telling which one you’re actually feeling.”

Objection Four — “Clients Will Notice and Feel Like They’re Getting Less”

“If a client finds out it’s automated, they’ll think we’re phoning it in.”

Genuinely — this rarely happens, and when it does, it’s not because of automation itself. It’s because the agency skipped the review step and sent something that read like a raw export.

Clients don’t evaluate reports by asking “was this built by a human or a system.” They evaluate them by asking, mostly unconsciously, “did this arrive on time, does it make sense, do I trust what it’s telling me.” A branded, well-written, on-time report passes that test regardless of what happened behind the curtain.

If anything, clients notice the opposite more. Late reports. Inconsistent formatting. A summary that clearly got dashed off in a hurry. Those are the things that quietly damage trust — and manual reporting produces them far more often than a properly reviewed automated process does.

Verdict: Myth — clients judge consistency, not the method behind it

Objection Five — “I’ll Lose Control Over What Goes to Clients”

“What if something goes out that I never actually saw?”

This is the one worth taking seriously, because it depends entirely on how the system gets configured. A poorly set up automation pipeline that sends reports directly to clients with zero review really would create this risk.

However, that’s a configuration choice, not an inherent property of automation. A properly built process generates a draft, holds it for review, and only sends after someone approves it. Control doesn’t disappear. It just moves from “control over building the report” to “control over approving the finished one” — which, honestly, is a better use of a busy person’s attention anyway.

Verdict: Real risk if configured badly, solved by a mandatory review step
The pattern across all five

Notice something? Almost every objection collapses down to the same root question: does a human still review this before a client sees it? Answer yes, and nearly every fear on this list stops applying. Answer no, and honestly, some of those fears were right to have.

The One Genuine Tradeoff Worth Naming Honestly

Not every concern is a myth to be debunked. There’s one real tradeoff, and it deserves an honest mention rather than getting smoothed over.

Setting up automated client reporting properly takes real time upfront — a couple of hours per client, done carefully, verifying data before trusting it. That’s genuinely true. It’s not five minutes, whatever the marketing headlines claim. Agencies expecting an instant switch sometimes feel let down by that reality.

But upfront time and ongoing time are different currencies. Two hours spent once, followed by fifteen minutes a month forever after, beats five hours spent every single month indefinitely. The math works out fast — usually within the very first reporting cycle. Still, it’s fair to name that the beginning takes more effort than the ads promise.

What tends to happen once agencies actually try it: Most of the skepticism fades within one or two reporting cycles — not because someone argued them out of it, but because they see their own numbers. Time saved. Report quality held steady, or improved. Clients not asking the same confused questions anymore. Direct experience settles most objections faster than any blog post can.

How RaiseReturn Handles the Legitimate Concerns

RaiseReturn connects to GA4, Google Ads, Meta Ads, Search Console, and PageSpeed, and builds a branded, AI-written draft report automatically. But nothing sends without review — that step is built in, not optional, because the objections above are reasonable and deserve a real answer, not a workaround.

Data verification happens during setup, catching the kind of tracking issues that would otherwise embarrass a manual report just as easily as an automated one. The result is a system built around the actual concerns agencies raise, rather than pretending those concerns don’t exist.

See it for yourself instead of taking our word for it

RaiseReturn generates fully branded automated client reports in under 60 seconds, with a built-in review step before anything reaches a client. Google Analytics automated reports, done the way the skeptics would actually approve of. First 30 days free, no card required.

Start Your Free Trial →

Common Questions About Automated Client Reporting Concerns

Can automated client reports get data wrong?
Yes, if the underlying data source has a tracking error, an automated report will faithfully repeat it. This isn’t unique to automation; manual reports built from the same broken tracking would show the same mistake. The real safeguard is verifying GA4 conversion events during setup and reviewing each report before it reaches a client, regardless of whether the report was built manually or automatically.
Do automated reports feel impersonal to clients?
Not when a human reviews and personalises each report before sending. Automated client reporting handles data collection and drafting; the account manager still adds context from recent conversations and adjusts the tone. Clients notice thoughtful, consistent communication far more than they notice whether a human or a system pulled the underlying data.
Is automated reporting only worth it for large agencies?
No. Smaller agencies and freelancers often benefit the most, since manual reporting consumes a larger percentage of their limited time. An agency managing five clients can recover 15 to 25 hours a month by automating Google Analytics automated reports, time that would otherwise go entirely into repetitive data pulling.
What happens if a client asks a question the automated report doesn’t answer?
The account manager answers it directly, the same way they always have. Automated client reporting replaces the production work behind a report, not the relationship or the follow-up conversation. If anything, freeing up hours previously spent formatting data gives account managers more time to respond to exactly these kinds of questions.

Most objections to automated client reporting aren’t really about the technology. They’re about trust — trusting a system with something that used to require constant hands-on attention. That’s a reasonable thing to be careful about.

Just don’t let caution become an excuse to keep doing five hours of work a system can do in five minutes, reviewed properly, every single time.

How Better Reporting Actually Raises the Return Your Agency Delivers (Not Just How It Looks)

Ask an agency owner what raises client ROI, and you’ll hear about creative testing. Bid strategy. Audience refinement. Reasonable answers, all of them. Reporting rarely makes the list. Which is strange, honestly, because reporting is where most of the actual decisions get triggered.

Here’s the thing nobody says out loud.

A campaign can be optimized brilliantly and still underdeliver — simply because nobody noticed the shift in time to act on it. That’s not a strategy problem. That’s a visibility problem. And visibility is exactly what reporting is supposed to solve, when it actually works the way it should.

Why Agencies Treat Reporting as a Cost, Not a Lever

Most agencies think about reporting the way they think about invoicing. Necessary. Unglamorous. Something that happens after the real work is done. Consequently, it gets minimal investment, minimal thought, and gets squeezed into whatever hours are left at month-end.

That framing misses something important, though. Reporting isn’t just documentation of what happened. Done properly, it’s the mechanism that decides what happens next — which channels get more budget, which creative gets paused, which audience segment gets expanded. Treat it as an afterthought, and you’re not just producing a worse document. You’re slowing down every decision that document was supposed to trigger.

Something worth chewing on

“We found a channel bleeding budget for six weeks before anyone caught it in a report. Six weeks. Not because nobody cared — because reporting happened once a month, late, and buried in a pile of numbers nobody had time to really dig through. The campaign wasn’t badly managed. The visibility into it was.”

6 wks
Average time a budget-draining issue can hide in a delayed manual reporting cycle
18%
Typical wasted spend recoverable through faster issue detection
1 day
Detection window with consistent automated client reporting vs weeks manually

The Speed Gap Nobody Accounts For

Here’s a comparison worth sitting with. Not theoretical — this is roughly how the timeline actually plays out at most agencies, with and without automated reporting for clients keeping pace with what’s happening.

Manual Reporting Timeline
  • Day 3A channel’s CPA quietly starts climbing. Nobody’s looking yet.
  • Day 14Still climbing. Still nobody’s pulled the data to check.
  • Day 28Month-end. Report gets built. Rushed, like always.
  • Day 30Issue finally noticed. A month of wasted spend, gone.
Automated Reporting Timeline
  • Day 3Same channel, same shift. Data’s already flowing consistently.
  • Day 7Weekly or biweekly check catches the trend forming.
  • Day 8Account manager flags it, adjusts budget the same day.
  • Day 30Twenty-two days of wasted spend avoided entirely.

Same underlying issue, both cases. Completely different outcome. The gap isn’t about smarter people or better strategy — it’s purely about how fast the information reached someone who could act on it.

Marketing agency analyzing automated client reporting data to improve client ROI and budget allocation

The same data, noticed three weeks sooner, changes the entire financial outcome of a campaign.

Five Real Ways Automated Reporting Pushes Return Up

None of these are dramatic on their own. That’s kind of the point. Small, consistent improvements, stacked over months, add up to a meaningfully different outcome than one big flashy optimization ever could.

1

Faster problem detection

When data flows consistently instead of arriving in a once-a-month dump, budget-draining trends get caught in days, not weeks. Every day saved is spend that didn’t get wasted on something already known not to work.

2

Sharper budget reallocation

Consistent month-over-month comparisons make it obvious which channels are earning more budget and which have plateaued. Nobody’s guessing based on gut feeling from three months ago — the current picture is always right there.

3

More thinking time, less formatting time

Hours previously spent pulling GA4 exports and rebuilding charts become hours spent actually analyzing what the numbers mean. That shift alone changes the quality of the strategic decisions an account manager makes.

4

Fewer missed patterns across the account

A rushed manual report focuses on the headline numbers and skips the quieter signals. Automated reporting for clients surfaces the same full picture every cycle, so smaller but meaningful patterns don’t slip through unnoticed.

5

Better client conversations, sooner

When a client sees an issue flagged and addressed within the same reporting cycle, not two months later, they trust the agency’s judgment more. That trust translates into approval for bolder tests and bigger budget conversations down the line.

“You don’t raise a client’s return by working harder on the campaign. You raise it by noticing what’s happening inside that campaign faster than you used to.”

A Concrete Example — Reallocation in Practice

Consider a client running budget across Google Ads and Meta simultaneously. Say Meta’s cost per lead climbs steadily over three weeks while Google Ads stays flat. In a manual reporting cycle, that trend probably doesn’t surface clearly until the monthly report gets built — by which point three weeks of increasingly expensive leads have already happened.

With consistent automated reporting for clients, that same trend appears in the data the moment it starts forming. An account manager glancing at a weekly or biweekly automated summary catches the climb early, shifts budget toward the better-performing channel, and the client’s blended CPA never gets the chance to drift as far off course. The strategy didn’t change. The speed of noticing did — and that speed is worth real money.

The part that’s easy to miss

None of this requires a smarter campaign strategy. It requires the same strategy, applied with better timing, because the information reached someone sooner. That’s a less exciting story than “we found a genius new targeting trick,” but it’s a far more consistent driver of actual return.

Why Manual Reporting Structurally Can’t Keep This Pace

This isn’t a knock on the people doing manual reporting. It’s a structural limitation. Pulling GA4 exports, formatting Google Ads tables, and writing summaries for ten or fifteen clients takes real hours — hours that get scheduled for month-end because that’s when reporting happens, not because that’s when problems happen.

Problems don’t wait for month-end. They start whenever they start. Consequently, a reporting cadence tied to a monthly calendar rather than to actual data monitoring is always going to lag behind reality by however many weeks separate the problem’s start from the report’s delivery. Automated client reporting removes that lag by making the data checking cost nearly nothing — fifteen minutes instead of five hours — so checking more often stops being a resourcing decision.

What this looks like across a full client roster: An agency managing fifteen clients with automated reporting can realistically review performance weekly for every account, something almost impossible with manual reporting at that scale. Fifteen weekly fifteen-minute reviews is roughly four hours a week. Fifteen monthly five-hour manual builds is closer to nineteen hours a month, arriving too late to act on half of what it reveals.

Where RaiseReturn Fits Into Raising That Return

RaiseReturn connects to GA4, Google Ads, Meta Ads, Search Console, and PageSpeed, pulling data automatically and generating a branded, AI-written report in under 60 seconds. The name isn’t an accident — the whole point is closing the gap between something happening in a campaign and someone actually noticing it.

Faster noticing means faster reallocation. Faster reallocation means less wasted spend and more budget flowing toward what’s actually working. None of that requires a smarter strategy. It just requires the reporting to keep pace with what’s actually happening in the account, instead of trailing three or four weeks behind it.

Stop finding out three weeks late

RaiseReturn automates data collection from GA4, Google Ads, Meta Ads, Search Console, and PageSpeed, so performance shifts surface fast enough to actually act on. Automated client reporting built to raise the return you deliver, not just save you an afternoon. First 30 days free, no card required.

Start Your Free Trial →

Common Questions About Reporting and Client Return

How does automated reporting improve client ROI, not just save time?
Automated reporting improves client ROI by surfacing performance shifts faster than manual reporting cycles allow, giving account managers more time to act on data instead of formatting it, and reducing the chance that a profitable trend or a wasteful channel goes unnoticed for weeks. The time savings are real, but the return improvement comes from faster, more consistent decision-making enabled by that time.
Can faster reporting actually change campaign performance?
Yes, indirectly but measurably. When an underperforming channel gets flagged within days rather than discovered at month-end, budget gets reallocated sooner, reducing wasted spend. Automated client reporting shortens the gap between a problem occurring and someone noticing it, which compounds into real budget efficiency over a quarter or a year.
What is the connection between automated reporting for clients and budget allocation decisions?
Automated reporting for clients presents month-over-month comparisons and channel-level performance consistently, making it easier for account managers to spot which channels deserve more budget and which are underperforming. When this data arrives reliably every month rather than sporadically, budget reallocation conversations happen proactively instead of reactively after a quarter of wasted spend.
How does RaiseReturn help agencies raise the return they deliver to clients?
RaiseReturn automates data collection from GA4, Google Ads, Meta Ads, Search Console, and PageSpeed, freeing account managers from hours of manual reporting each month. That recovered time goes toward analysis and strategic adjustments, and the consistent monthly cadence means performance shifts get noticed and acted on faster, directly supporting better client outcomes over time.

Nobody raises a client’s return by staring at a spreadsheet longer. They raise it by seeing the right thing at the right moment, and actually having the time left to do something about it.

Notice sooner. Act sooner. That’s the whole trick.