I’ve personally looked at over a thousand monthly performance reports. Maybe more. Furthermore, the majority of them have the same problem — they’re not built to be read, they’re built to be sent.
There’s a difference. A big one.
A report built to be sent exists to check a box. It gets exported from GA4, pasted into a slide deck, and shipped off at 11 PM with a one-line summary nobody spent more than ninety seconds writing. However, a report built to be read does something completely different — it tells the client a story they actually want to follow.
Furthermore, I’ve spent two decades building data pipelines for marketing platforms, and the technical side of this is genuinely the easy part. Specifically, GA4’s API isn’t that complicated once you’ve fought with its quirks a few hundred times. Consequently, the hard part was never pulling the data. It was figuring out what to actually do with it once you had it.
Why Most Monthly Performance Reports Are Genuinely Bad
Let me describe the typical monthly performance report, because I think most agency owners have stopped seeing how bad theirs actually is. Specifically, page one is a wall of GA4 metrics with zero context. Furthermore, page three is a Google Ads table with twelve columns nobody asked for. Moreover, the summary paragraph reads like it was written by someone checking the clock, not someone who cares.
Here’s the thing. None of this happens because account managers are lazy. Therefore, it happens because manually pulling data from GA4, Meta, and Search Console is genuinely exhausting work. Specifically, GA4’s interface alone can eat forty-five minutes per client if you’re hunting for the right date comparison view.
“I once timed myself manually building one client’s monthly report from scratch — GA4, Google Ads, Meta, and Search Console combined. Four hours and twenty minutes. Furthermore, that’s just the data collection and formatting. The actual writing came after. Consequently, I understood viscerally why every account manager I’ve ever met hates the last week of every month.”
The Anatomy of a Monthly Performance Report That Actually Works
Specifically, here’s the structure I’ve watched succeed across hundreds of agency accounts. Furthermore, it’s not complicated. It’s just intentional — every section earns its place.
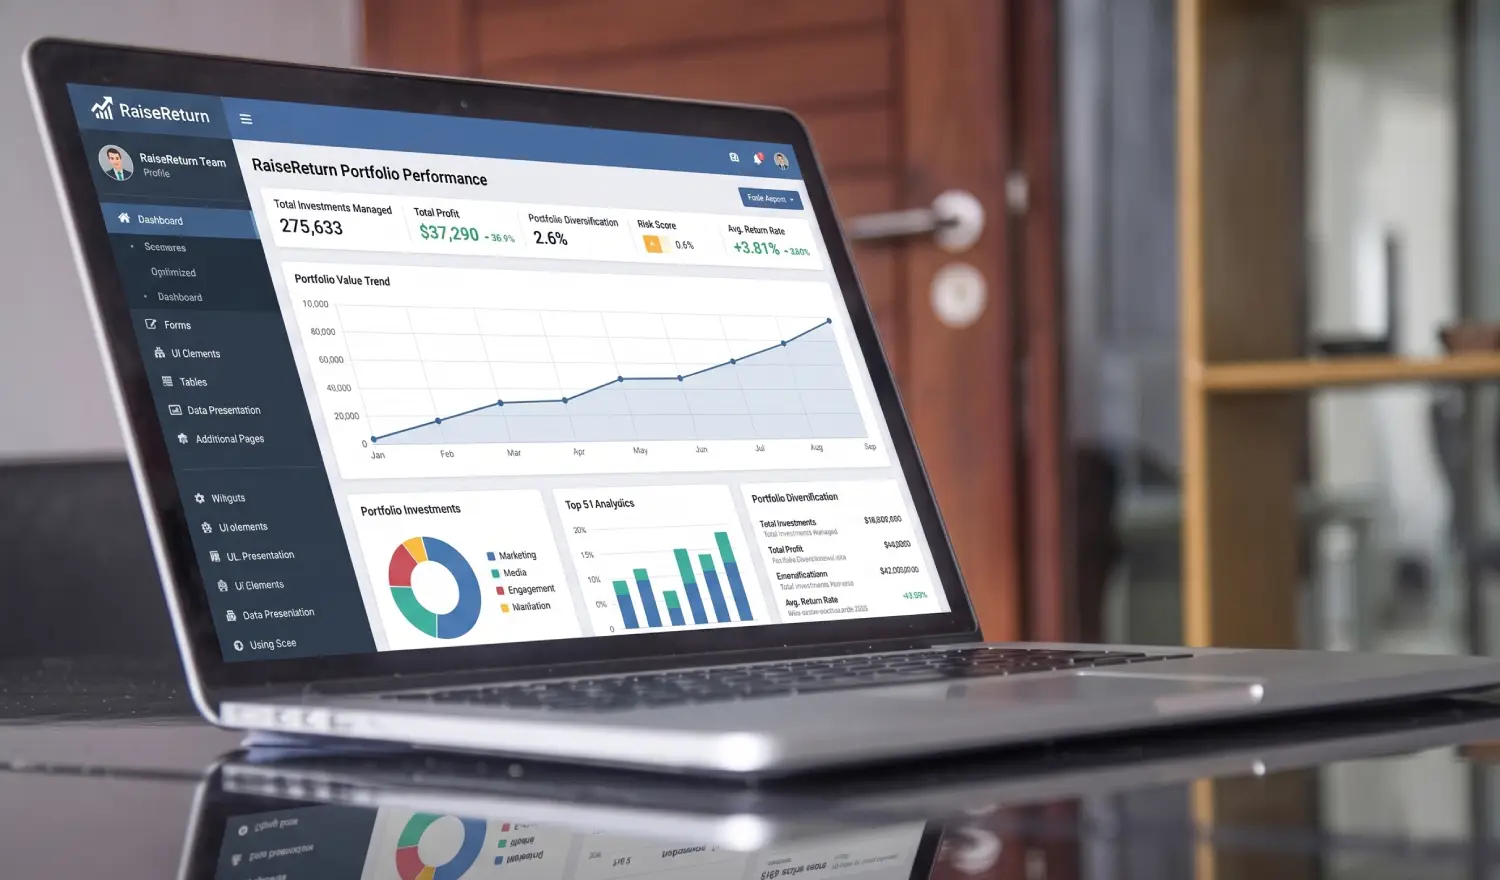
A well-structured monthly performance report guides the reader through a story — not just a stack of numbers from each platform.
Specifically, this section answers one question: was this a good month or a bad one, and why? Furthermore, it should mention the headline number, what drove it, and what to watch going forward. Therefore, a client who reads only this paragraph should still understand the state of their account.
Specifically, pick four to six numbers that matter most for this client’s goals. Furthermore, every number needs a month-over-month comparison arrow. Consequently, a single number without context — “312 leads” — tells the reader almost nothing useful on its own.
Specifically, each channel gets its own short section with the relevant metrics and two to three sentences explaining the story. Furthermore, this is where you translate platform jargon into plain English. Moreover, nobody outside the industry knows what a “thumb stop rate” is, so explain it inline.
Specifically, call out genuine wins with evidence attached. Furthermore, be direct about what didn’t go well and why. Therefore, clients trust agencies that explain a rough patch clearly far more than agencies that quietly bury it inside a vague sentence about “market conditions.”
Specifically, this is the most underrated section in any monthly performance report. Furthermore, it transforms a backward-looking document into one with momentum. Consequently, clients who see a clear plan ahead don’t spend the next month wondering whether their agency is actually thinking strategically.
What Good vs Bad Actually Sounds Like
Specifically, here’s the difference in practice. Furthermore, the data underneath each example below is identical. Therefore, the only thing that changed is the writing.
“Meta performance was broadly in line with expectations this period. Several campaigns showed positive trends while others faced challenges consistent with seasonal patterns.”
“Meta CPL rose 24% in May, driven by increased competitor spend ahead of summer. We’ve paused three underperforming ad sets and launched two new creative angles — expecting CPL to normalise by late June.”
Specifically, the second version costs maybe ninety more seconds to write. However, it builds significantly more trust. Consequently, that ninety seconds is one of the highest-leverage things any account manager does all month.
“A monthly performance report isn’t a data dump. It’s a confidence-building document. Write it like someone is actually going to read it — because someone is.”
How I Built the Pipeline That Automates This Entirely
Furthermore, let me get specific about the engineering side, because I think this is genuinely interesting if you’ve ever wrestled with these APIs yourself.
Specifically, RaiseReturn connects to GA4, Google Ads, Meta Ads, Search Console, and PageSpeed using OAuth 2.0 authentication per client. Furthermore, each platform’s reporting API gets queried on a schedule, normalised into a common data structure, and dropped into the report engine.
Consequently, the system handles rate limits, token refreshes, and platform-specific data quirks automatically. Therefore, the account manager never touches any of that complexity. Moreover, they receive a finished report with an AI-written first draft of every narrative section, ready for a quick review.
What Changes Once the Report Builds Itself
Specifically, the shift isn’t just about time saved, although that’s significant. Furthermore, it’s about what account managers do with the time they get back.
Consequently, instead of spending four hours formatting tables, they spend fifteen minutes reading the AI-generated draft and adding genuine insight. Therefore, the monthly performance report stops being a chore and starts being a genuine touchpoint — one where the account manager’s actual expertise shows up clearly, rather than getting buried under spreadsheet work.
Real outcome: Agencies using RaiseReturn typically cut monthly reporting time by 80% or more. Furthermore, report quality improves because the time saved goes directly into the writing and strategic commentary — the part clients actually read and remember.
Three Mistakes I Still See Constantly
Leading with vanity metrics
Specifically, impressions and reach numbers look impressive but rarely connect to business outcomes. Furthermore, lead with conversions, revenue, or whatever metric actually maps to the client’s goals. Therefore, save the vanity metrics for a supporting role, if you include them at all.
Skipping the comparison
Specifically, a number without a month-over-month comparison is just a number floating in space. Furthermore, every key metric needs context against last month — and ideally last year too, if seasonality matters for that business.
Forgetting the next steps section
Specifically, this is the section most agencies skip when they’re rushing at month-end. However, it’s the one that makes a monthly performance report feel forward-looking instead of purely historical. Therefore, never send a report without it.
Watch out for this: A monthly performance report that only looks backward leaves clients wondering what happens next. Specifically, three bullet points about next month’s focus costs almost nothing to write but changes how the entire report feels to read.
Build this exact report structure automatically
RaiseReturn connects to GA4, Google Ads, Meta Ads, GSC, and PageSpeed — and generates a fully branded monthly performance report with AI-written summaries in under 60 seconds. First 30 days free, no card required.
Start Your Free Trial →Common Questions About Monthly Performance Reports
Specifically, the agencies that win long-term retainers aren’t the ones with the fanciest dashboards. Furthermore, they’re the ones whose reports actually get read, understood, and trusted every single month.
Build it properly once. Automate it forever after.