Most agencies run genuinely solid digital marketing campaigns. The targeting is sharp. The social media content connects. The ad spend is managed responsibly. However, the clients don’t know any of that — because the monthly report doesn’t tell them.
That gap is where churn begins.
Specifically, a digital marketing report that lists impressions, reach, and click-through rates without explaining what those numbers mean for the business isn’t a report. Furthermore, it’s a data export with a logo on the front. Consequently, clients who can’t interpret what they’re reading start doubting whether the work is actually producing anything — and that doubt compounds quietly until they start looking for a different agency.
The Reporting Disconnect That Costs Agencies Real Money
Specifically, digital marketing agencies produce two types of output every month. The first type is the actual work — campaigns optimised, social media content published, budgets managed, audiences refined. Furthermore, this is where most agencies invest their expertise and attention, which makes complete sense. However, the second output is the communication layer — the report that explains what happened and why. Moreover, most agencies treat this as an afterthought rather than a deliverable.
Consequently, clients receive polished campaigns and confusing reports. Therefore, they trust the agency less than the results warrant — because the results are never communicated in a way they can actually understand or share internally.
“My agency sends me a PDF every month. It’s about twenty pages. I scroll through it, see a lot of graphs, and then look for one number that tells me if things are going up or down. I usually can’t find it. So I forward the whole thing to my business partner and say ‘does this look right to you?’ Neither of us really knows.”
Vanity Metrics vs Value Metrics — The Core Problem in Social Media Reporting
Social media reporting has a specific version of this problem. Specifically, social platforms surface numbers that look impressive but rarely connect to business outcomes — and most agencies report those numbers without questioning whether clients actually need them.
Furthermore, reach and impressions sound meaningful. They’re large numbers. Consequently, they fill slides and make reports look substantial. However, a business owner who spent $2,500 on social media management last month doesn’t need to know their posts reached 84,000 people. They need to know whether those 84,000 people did anything useful — clicked through, enquired, purchased, or at minimum developed the kind of brand familiarity that influences future buying decisions.
- Total reach and impressions
- Raw follower count
- Total likes and reactions
- Post frequency and volume
- Video views without context
- Gross engagement (total interactions)
- Story views without downstream tracking
- Website clicks from social with UTM attribution
- Conversion rate of social traffic
- Leads or enquiries attributed to social
- Cost per result (paid social only)
- Engagement rate vs industry benchmark
- Revenue or goal value from social channel
- Share of voice vs competitors (where trackable)
Specifically, the fix here isn’t eliminating reach and impressions entirely — they matter for context. Furthermore, the fix is ensuring they never lead the report. Consequently, when a report opens with “your posts reached 84,000 people and drove 312 website visits, 18 of which completed an enquiry form,” the client understands both the scale and the outcome in a single sentence. Therefore, value metrics give vanity metrics meaning rather than replacing them.
Why Digital Marketing Reporting Breaks at Scale
Specifically, the reporting problem gets dramatically worse as an agency grows. Furthermore, managing five clients manually is exhausting but achievable. Managing fifteen or twenty clients with the same manual process means someone is always finishing a report late, writing a rushed summary, or copying a paragraph from last month’s report and updating the numbers. Consequently, quality degrades precisely at the moment it should be improving.
Moreover, digital marketing reports require data from multiple platforms — Google Analytics 4 for website performance, Google Ads for paid search, Meta Ads for paid social, Search Console for organic visibility, and the social media platforms themselves for organic social. Therefore, manually pulling, formatting, and reconciling data from five or six different sources for twenty clients every month isn’t a workflow — it’s a crisis that repeats on a 30-day cycle.
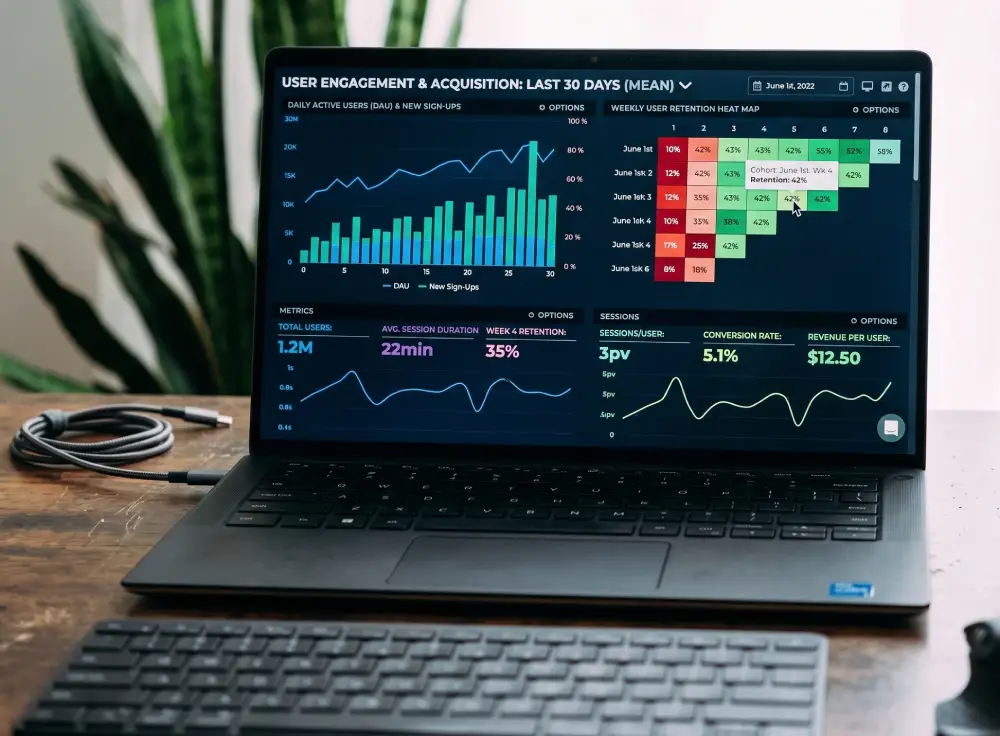
When digital marketing and social media data flows automatically into one branded report, account managers spend their time on strategic analysis rather than platform exports.
The platform-hopping problem
Specifically, every digital marketing platform speaks its own language. Furthermore, Meta calls conversions “results.” Google Ads calls them “conversions.” GA4 calls them “conversion events.” Consequently, a client who receives data from three platforms without a normalised narrative ends up with three different words for the same concept — and often three different numbers that don’t add up, because attribution overlap isn’t explained. Therefore, the confusion clients experience isn’t stupidity. It’s a direct consequence of agencies forwarding raw platform data instead of translating it.
The attribution conversation nobody wants to have: Specifically, a client who sees 40 conversions reported in Google Ads and 35 in Meta Ads and 28 in GA4 for the same month will ask why the numbers don’t match. Furthermore, that conversation takes thirty minutes to explain and leaves the client uncertain even after the explanation. Consequently, an automated digital marketing report that addresses attribution methodology proactively — in plain English, before the client asks — eliminates that uncertainty entirely.
How to Structure the Social Media Section of a Digital Marketing Report
Specifically, social media reporting needs its own structured section in any digital marketing report — but most agencies either give it too much space (pages of screenshot grids) or too little (three lines buried in a general performance summary). Furthermore, the right approach sits between those extremes. Consequently, here’s what each major social platform’s section should cover and what to actively skip.
Report: spend, CPL or CPR, reach, top-performing creative
Specifically, paid Meta performance lives and dies by cost per result. Furthermore, show spend vs the previous month, results achieved, and cost per result with a MoM comparison. Moreover, include the top-performing ad creative with a brief note on why it outperformed.
Skip: raw impressions, story views without conversion data, follower changes from organicReport: engagement rate, leads generated, ad performance if running
Consequently, LinkedIn organic content often has lower reach but higher quality engagement. Therefore, report on engagement rate rather than raw numbers. Furthermore, if running LinkedIn Ads, show cost per lead against benchmark and the best-performing content format.
Skip: connection count changes, impressions without engagement contextReport: engagement rate, website referral clicks, best content
Specifically, organic social’s primary value is brand presence and community. Furthermore, report on engagement rate against an industry benchmark rather than raw numbers. Moreover, show which content drove the most website clicks via UTM-tagged links. Consequently, the client understands what’s working creatively.
Skip: follower growth as a primary KPI, likes without engagement rate contextReport: total paid social spend, total results, blended CPA
Furthermore, clients who run paid activity across multiple platforms need a blended view. Specifically, show total digital marketing spend on social, total results across all paid channels, and the blended cost per acquisition. Therefore, the client sees the combined efficiency — not just individual platform snapshots.
Skip: platform-level attribution debates in the report — address separately if needed“Social media reporting isn’t about showing how much happened. It’s about showing whether any of it mattered to the business. Those are completely different documents.”
How to Fix Digital Marketing Reporting Without Rebuilding Everything
Specifically, the fix doesn’t require redesigning your entire agency process from scratch. Furthermore, it requires changing two things: what order information appears in the report, and how the narrative gets written. Consequently, the data can stay largely the same — it’s the structure and the story around it that transforms client comprehension.
Start with outcomes, not activity
Specifically, the first thing a client reads should answer “did digital marketing work this month?” Furthermore, that means leading with conversions, leads, revenue, or whatever business outcome the client cares about. Consequently, the reach figures, impression counts, and click-through rates become supporting evidence rather than the headline.
Translate every metric into plain English
Furthermore, every number should have a sentence explaining what it means for the client’s business — not a label, but an interpretation. Specifically, “engagement rate 4.2%” means nothing to most business owners. However, “4.2% engagement rate — nearly double the industry average for your sector — means your audience is genuinely interested in what you post” means something real.
Include month-over-month comparison on every key metric
Specifically, numbers without context are almost useless for client communication. Furthermore, every key digital marketing metric in the report should show the current period figure alongside the previous month’s figure and the percentage change. Consequently, clients immediately understand whether performance is improving or declining — without needing to remember last month’s numbers themselves.
Add an honest wins and challenges section
Furthermore, this is the section most agencies skip — especially in difficult months. However, it’s the section that builds the most trust. Specifically, naming a challenge directly and explaining what the agency is doing about it demonstrates genuine accountability. Consequently, clients who feel honestly informed stay longer than clients who receive carefully managed positive framing.
Close with three specific next-month actions
Specifically, a report that ends with the previous month’s data leaves the client looking backward. Furthermore, one that ends with “here’s exactly what we’re doing next month and why” leaves them looking forward. Consequently, the relationship feels active rather than retrospective — and clients who feel a sense of forward momentum renew at significantly higher rates.
The Automation Layer That Makes This Sustainable
Specifically, knowing what a good digital marketing report looks like is half the problem. Furthermore, producing that quality consistently across fifteen or twenty clients every month — without the team burning out in the last week of every month — requires automating the production layer.
Consequently, when data collection, formatting, and first-draft narrative generation happen automatically, account managers have something genuinely different to do in month-end: review and improve rather than build from scratch. Therefore, the quality of thinking in the report goes up — because the person responsible for it arrives at the report with energy left over for thinking, rather than depleted from formatting.
Specifically, an account manager using automated digital marketing reporting doesn’t stop doing strategic thinking — they start doing more of it. Furthermore, instead of spending four hours pulling social media data and reformatting GA4 exports, they spend fifteen minutes reviewing an AI-written draft and adding the specific insights only they know from client conversations. Consequently, the report gets better because the person reviewing it has capacity to actually think about the client’s business.
What an automated digital marketing report pipeline looks like
Specifically, the automation connects to GA4, Google Ads, Meta Ads, and Search Console via API — one connection per client platform, set up once. Furthermore, data pulls on a defined schedule at the end of each reporting period. Moreover, an AI system reads the normalised data and writes the first draft of the executive summary, the channel performance summaries, and the wins and challenges section. Therefore, the account manager opens a finished draft rather than a blank page — and fifteen minutes of review produces a better report than four hours of manual construction.
The time maths at scale: Specifically, at fifteen clients, manual digital marketing reporting typically consumes 60 to 75 hours per month across the team. Furthermore, with automated reporting in place, that drops to roughly 15 hours of review time. Consequently, the team recovers 45 to 60 hours every single month — hours that go directly into campaign work, client strategy, and the kind of proactive thinking that actually drives better results and longer retentions.
Automate your digital marketing and social media reports — in one branded document
RaiseReturn connects to GA4, Google Ads, Meta Ads, Search Console, and PageSpeed. It pulls all your digital marketing and social media data automatically and generates a fully branded, AI-written report in under 60 seconds. First 30 days free, no card required.
Start Your Free Trial →Common Questions About Digital Marketing and Social Media Reporting
Specifically, the quality of a digital marketing campaign and the quality of the report that describes it are both completely within an agency’s control. Furthermore, most agencies invest heavily in the first and almost nothing in the second. Consequently, they run great campaigns for clients who never fully understand how good the work actually is — and eventually leave for an agency whose reports, however mediocre the campaigns, at least make sense.
Run better campaigns. Tell the story better. Keep the clients longer.