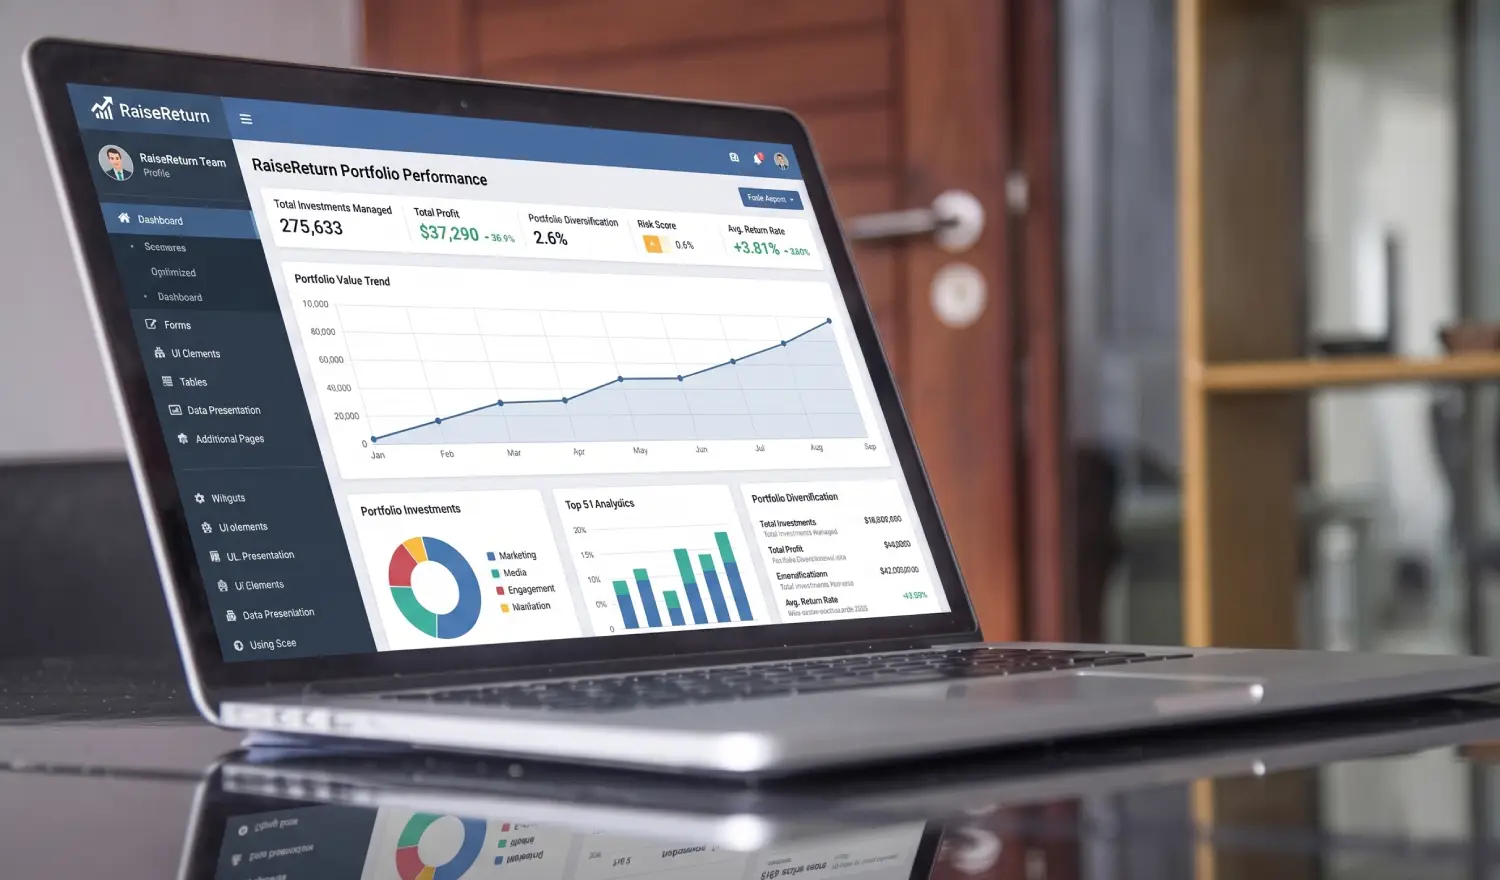
How Long Does It Actually Take to Set Up GA4 Automated Reports?

“Set up in five minutes.” You’ve seen that line. Probably a hundred times. And look — for a single, simple connection, it’s not exactly a lie. But five minutes to connect a data source isn’t the same as five minutes to trust the report that comes out of it. Those are two very different clocks.

Nobody talks about the second one.

So here’s an honest version. No sales pitch, no “in just a few clicks” nonsense. Just what actually happens, hour by hour, when an agency sets up Google Analytics automated reports properly for the first time — and why rushing it usually costs more time than it saves.

Why “Five Minutes” Is Technically True and Practically Useless

Here’s the thing about that five-minute promise. It’s describing one specific step: the OAuth connection between your GA4 property and whatever reporting tool you’re using. That part genuinely is fast. You click a few buttons, grant access, and data starts flowing. Done.

But that’s maybe 10% of what actually needs to happen before an automated report is something you’d feel comfortable sending a client. The other 90%? That’s verification, decision-making, and testing. And none of the marketing copy for any tool ever mentions that part, because it’s less exciting than “instant setup.”

A quote worth sitting with

“I connected our first client in about four minutes. Felt amazing. Then I spent the next two hours figuring out why our conversion numbers looked totally different from what we’d been reporting manually for a year. Turns out the connection speed was never the bottleneck. Trusting what came out the other end — that was the actual work.”

10 min
Time to technically connect a GA4 property via OAuth
2-3 hrs
Realistic total time for one client’s first proper setup
20-30 min
Time per additional client once your template exists

What Actually Happens, Hour by Hour

Let’s walk through it properly. This is what a careful first setup genuinely looks like — not the marketing version, the real one. Times will shift a bit depending on how messy the client’s GA4 property already is, but this is a fair average.

0-15
min

Connect the GA4 property

This genuinely is the fast part. OAuth authorisation, property selection, done. If someone told you setup takes five minutes, this is the five minutes they meant. Nothing wrong with that claim — it’s just incomplete.

15-60
min

Verify conversion events against GA4’s own interface

This is the part nobody warns you about. You need to open GA4 itself, check that every conversion event you’re about to automate actually fires correctly, and isn’t duplicated or missing context. Skip this, and you’re automating someone else’s mistake at scale.

60-90
min

Choose your metrics and build the template

Not every metric GA4 offers deserves a spot in a client report. This stretch is about deciding what actually matters — four to six numbers, tops — and configuring the branded structure those numbers will sit inside.

90-120
min

Run a full test cycle

Generate a report. Actually read it. Check the date range captured what you expected, confirm the comparison numbers make sense, and look for anything that reads oddly. This step catches the mistakes that only show up once you see the finished thing.

120-150
min

Adjust, review again, then go live

Almost nobody nails it on the first test. You’ll tweak a metric, fix a comparison, maybe rewrite a section of the summary. Then you run it once more. When it looks right, it’s ready — not before.

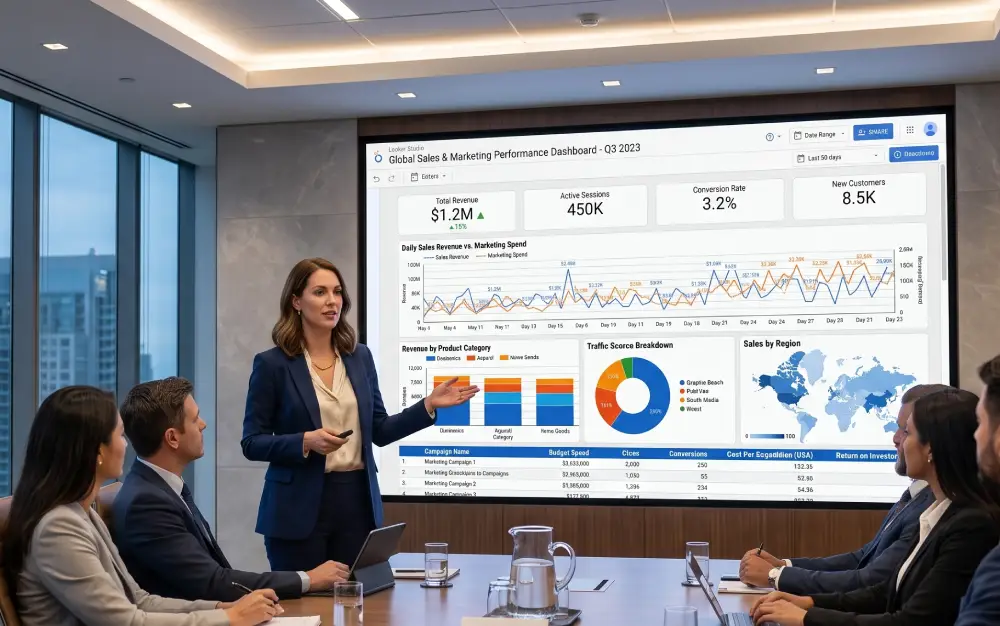
Agency setting up GA4 automated reports and automated client reporting with realistic timeline

The technical connection is quick. Building trust in what the report actually says takes longer — and that’s fine.

What Gets Promised vs What Actually Happens

Marketing copy for reporting tools tends to compress reality into a headline that technically isn’t false, just… optimistic. Here’s the honest gap.

What Gets Promised
  • “Set up in five minutes”
  • “Connect and go”
  • “Zero configuration needed”
  • “Instant automated reports”
  • “No technical skills required”
What Actually Happens
  • Connection takes minutes; trust takes hours
  • Connect, then verify, then decide, then test
  • Default templates need real customisation
  • First report is a draft you review, not a final send
  • True — but reading the output critically still matters

None of this means the tools are lying, exactly. It just means the five-minute headline describes the easiest step, not the whole job. If you go in expecting the whole job to take five minutes, you’ll either rush it or feel let down. Neither’s great.

“The connection is the easy part. Trusting the output is the actual work — and trust doesn’t happen in five minutes for anything that matters.”

Why the Extra Two Hours Actually Pays for Itself

Two to three hours sounds like a lot when you’re staring at a “connect in minutes” promise. Fair enough. But compare it to what you’re replacing: five hours of manual data-pulling and formatting, every single month, forever.

Do the setup properly once, and you never touch that manual process again. The two or three hours isn’t a monthly cost — it’s a one-time investment that pays back within the very first automated cycle. Rush it instead, skip the verification, and you risk sending a client a report with wrong numbers. That costs a lot more than two hours to fix — both in actual time and in the much harder-to-recover currency of client trust.

Worth remembering

Every minute spent verifying conversion events before launch saves considerably more time later, because catching a tracking error before a client sees it is infinitely cheaper than catching it after. The math only works in one direction.

Why Client Number Two Takes a Fraction of the Time

Here’s the good news nobody mentions in the “five minutes” pitch either: the first setup is the expensive one. Everything after that gets dramatically faster, because you’re not starting from zero anymore.

Your branded template already exists. Your metric selections are already decided — you’re just applying the same logic to a new account. Your review process is already a habit, not something you’re inventing on the spot. Connect the new client’s GA4 property, run one test, adjust anything specific to their account, and you’re done. Twenty minutes, maybe thirty if their tracking setup needs a bit more attention.

What this looks like at scale: An agency automating its fifth client isn’t doing fifth-time-the-work. They’re doing the same twenty-minute process they did for client three and four, because the hard thinking already happened once. By client ten, most agencies report the whole thing feels almost routine — check the data, apply the template, review, done.

The Honest Recommendation — Don’t Rush Client One

If you take one thing from this: don’t let the promise of speed pressure you into skipping steps on your very first automated client. That first setup is where you build the habits — and catch the mistakes — that determine whether every client after it goes smoothly.

Block out a genuine two-to-three-hour window. Treat it like the important work it is, not a quick task squeezed between calls. Verify the data properly. Test it before anyone client-facing sees it. Once that first one is solid, the rest genuinely does move fast — and that’s not a sales line, that’s just how the math works once the groundwork exists.

Set up GA4 automated reports the right way — without the guesswork

RaiseReturn connects to GA4, Google Ads, Meta Ads, Search Console, and PageSpeed, with built-in verification at every step. Automated client reporting that’s fast where it should be, and careful where it matters. First 30 days free, no card required.

Start Your Free Trial →

Common Questions About GA4 Automated Reports Setup Time

How long does it take to set up GA4 automated reports for one client?
For one client, expect roughly two to three hours the first time, spread across GA4 property connection, conversion event verification, template branding, and a test run. Most of that time goes into checking the data is accurate, not into the technical connection itself, which usually takes under fifteen minutes.
Does automated client reporting get faster after the first setup?
Yes, significantly. Once your branded template and review process exist, adding another client typically takes twenty to thirty minutes total. The heavy lifting happens once, during the first setup, not with every new client you add.
Why do GA4 automated reports take longer to set up than people expect?
Most of the time isn’t spent connecting data. It’s spent verifying that GA4 conversion events actually fire correctly, choosing which metrics matter, and configuring branding properly. Skipping these steps to save time usually costs more time later, fixing a report a client has already seen.
Can I automate GA4 reports the same day I decide to?
Technically yes, for a single client, if you dedicate a focused afternoon to it. Rolling automated client reporting out across a full roster in one day isn’t realistic if you want it done properly, since each client’s GA4 setup needs individual verification before you trust the output.

So — five minutes? Sure, for the click-and-connect part. Two to three hours for the version you’d actually stake your agency’s reputation on? That’s closer to true. And after that first client, everything speeds up anyway.

Give the first one the time it deserves. Everything after gets easy.

7 Mistakes Agencies Make the First Time They Automate Google Analytics Reports

Every agency that switches to Google Analytics automated reports goes through the same phase. Excitement first. Then a mistake nobody warned them about. Specifically, the tool itself rarely causes the problem — the setup does. And setup mistakes are almost always invisible until a client notices before you do.

That’s the version nobody wants to happen.

Furthermore, having watched dozens of agencies make this switch, the same seven mistakes show up again and again. Consequently, none of them are complicated to avoid once you know they’re coming. Therefore, this is the list you want to read before your first automated report goes out — not after a client emails asking why the numbers look wrong.

Mistake #1 — Automating Everything at Once

1
Switching all clients to automated reporting on the same day

Specifically, the excitement of finally automating GA4 reports makes agencies want to flip the switch for every client at once. Furthermore, this feels efficient — one setup session, done. However, it means every configuration mistake, every conversion event gap, and every branding issue surfaces simultaneously, across every client, at the worst possible moment.

Consequently, agencies that automate everything at once often spend the first reporting cycle firefighting instead of reviewing. Therefore, problems that would have been minor with one client become a genuine crisis across fifteen.

The fix Automate one client first. Run a full reporting cycle. Review the output carefully, fix anything wrong, and only then roll out to the rest of your roster.

Mistake #2 — Skipping GA4 Conversion Event Verification

2
Trusting that GA4 conversion events are set up correctly without checking

Specifically, this is the single most common cause of wrong-looking automated reports — and it has nothing to do with the automation tool. Furthermore, if a GA4 property has a conversion event misconfigured, duplicated, or simply not firing correctly, the automated report will faithfully report that broken data. Consequently, the tool didn’t fail. The underlying GA4 setup did.

Moreover, this problem often predates automation entirely — a tracking issue that’s existed for months, quietly. However, manual reporting sometimes masked it because a human noticed something looked off and adjusted the narrative. Automation doesn’t do that unless you build the check in.

The fix Before automating any client, cross-check GA4’s real-time and standard reports against the events you plan to automate. Confirm each conversion event fires correctly and isn’t double-counting.
What this looks like in practice

“We automated a client’s reports and the conversion number looked amazing — nearly double what we’d been manually reporting. Turned out their GA4 had two conversion events firing for the same form submission, both counted. We’d been under-reporting slightly by hand for months without realising, and automation just faithfully repeated a bug we’d never caught.”

42%
of first-time GA4 automation setups reveal a pre-existing tracking issue
1 client
Recommended pilot group size before automating your full client roster
15 min
Time a proper GA4 verification check typically takes per client

Mistake #3 — Including Every Metric Instead of the Right Ones

3
Trying to replicate every metric from the old manual report

Specifically, agencies new to automated client reporting often approach the template with a “just include everything we used to show” mindset. Furthermore, this feels safe — nothing gets left out. However, it produces an automated report just as overwhelming as the manual one, only delivered faster and with less thought behind what actually matters.

Consequently, the whole point of automating GA4 reports gets undermined. Therefore, speed without clarity just means clients receive confusing reports on time instead of confusing reports late.

The fix Before building your template, pick four to six metrics genuinely tied to business outcomes. Everything else becomes optional supporting detail, not a headline number.
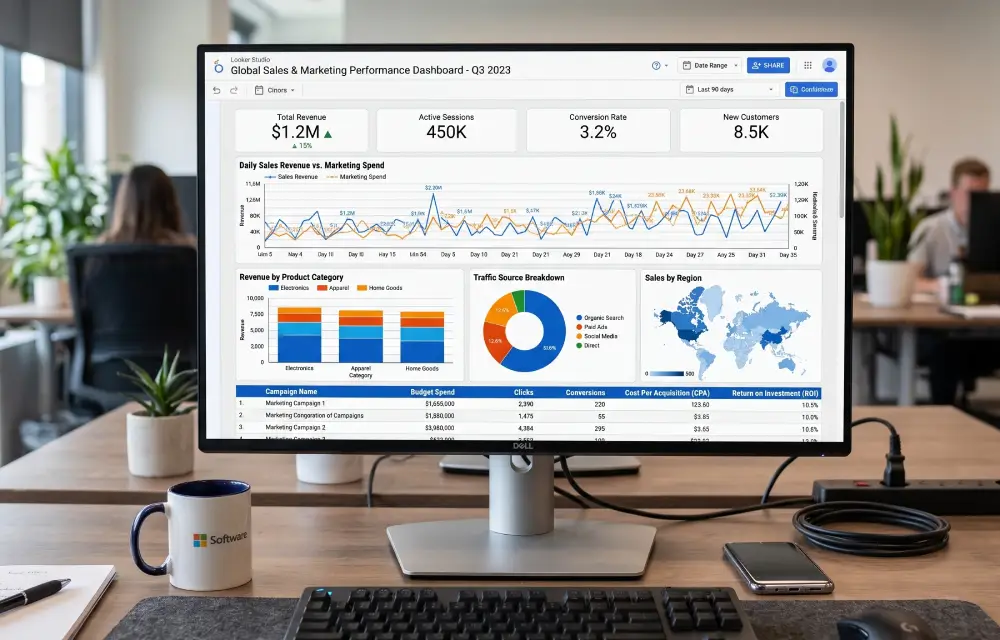
Agency reviewing GA4 automated reports and automated client reporting setup avoiding common mistakes

Most GA4 automation mistakes trace back to setup decisions made before the first report ever generates — not the automation itself.

Mistake #4 — Skipping the Human Review Step Entirely

4
Letting fully automated reports go straight to clients, unreviewed

Specifically, the appeal of automation is obvious — set it up once, let it run forever. Furthermore, some agencies take this literally and configure reports to send directly to clients with zero human review. However, this removes the one safeguard that catches errors, adds context the system doesn’t know, and keeps the report feeling genuinely personal.

Consequently, when something does go wrong — a data anomaly, an unusual spike, a genuinely bad month that needs careful framing — nobody catches it before the client does. Therefore, full automation without review trades a manageable time cost for an unmanageable trust risk.

The fix Build a review window into your schedule. Reports generate a day or two before delivery, giving the account manager time to read, adjust, and approve before anything reaches the client.

“Automation should remove the production work, not the judgment. The moment you remove both, you’ve built a system that can embarrass you at scale instead of one client at a time.”

Mistake #5 — Ignoring Branding Until the Reports Are Already Live

5
Treating white label branding as an afterthought, not part of setup

Specifically, agencies eager to get automated reporting working often connect the data first and worry about branding later. Furthermore, “later” sometimes means after the first report already went out looking generic — undermining exactly the professional impression automation was supposed to create.

Consequently, clients notice a mismatch between the agency’s usual polish and a report that looks like an unbranded export. Therefore, first impressions of the new reporting system suffer unnecessarily, right when you need them to land well.

The fix Configure your logo, brand colours, and template structure before connecting your first client’s data. Branding takes fifteen minutes and applies to every report afterward.

Mistake #6 — Not Testing the Delivery Schedule Before Go-Live

6
Assuming the delivery schedule works without a test run

Specifically, timezone mismatches, incorrect date range settings, and delivery schedule confusion are more common than agencies expect. Furthermore, a report scheduled to generate “end of month” can mean different things depending on how the system interprets the date boundary — sometimes generating a day early with incomplete data.

Consequently, the first automated report a client receives might quietly show a partial month rather than the complete one. Therefore, this specific mistake is easy to miss because the report still looks correct at a glance.

The fix Run a test cycle before the real delivery date. Confirm the report captures the full period intended and generates with enough buffer time for review.

Mistake #7 — Treating Automated Client Reporting as “Done” After Setup

7
Not revisiting the template after the first few reporting cycles

Specifically, automated client reporting isn’t a “set once, ignore forever” system. Furthermore, client goals shift, new conversion events matter, and platforms occasionally change how they report certain metrics. Consequently, a template that was perfect at setup can quietly drift out of relevance over six or twelve months.

Moreover, agencies who never revisit their automated report structure risk the same staleness problem manual reporting had — just automated, and therefore easier to overlook because it “just works” without anyone checking.

The fix Schedule a quarterly review of your report templates. Confirm the metrics still match client goals and adjust as priorities shift.

The Pre-Launch Checklist That Prevents All Seven

Specifically, most of these mistakes share a common root cause — moving too fast through setup because automation feels like it should be instant. Furthermore, it can be fast, but the setup deserves fifteen focused minutes per client rather than zero. Therefore, here’s the checklist that catches all seven mistakes before they reach a client.

Before Your First Automated GA4 Report Goes Live

Verify conversion events against GA4’s own interface

Specifically, cross-check every metric you plan to automate against GA4’s real-time and standard reports before trusting it.

Configure branding before connecting any client data

Furthermore, logo, colours, and template structure should be locked in before the first report generates.

Select four to six core metrics tied to business outcomes

Consequently, resist the urge to replicate every metric from your old manual template.

Run one full test cycle before going live with a real client

Specifically, confirm date ranges, delivery timing, and report completeness before automating anything client-facing.

Build in a human review window before delivery

Furthermore, schedule reports to generate a day or two ahead of delivery so someone reviews before clients see anything.

Automate one client first, then expand gradually

Therefore, roll out to your full roster only after confirming the first client’s reporting cycle went smoothly.

Why this checklist matters more than the tool you choose

Specifically, most GA4 automated report failures trace back to setup decisions, not the underlying software. Furthermore, even the most sophisticated automated client reporting tool will faithfully reproduce a broken conversion event or a poorly chosen metric set. Consequently, the fifteen minutes spent on proper setup determines whether automation feels like a genuine upgrade or a faster way to send confusing reports.

Why Getting This Right the First Time Actually Matters

Specifically, the stakes of a rocky first automation experience go beyond one awkward client email. Furthermore, agencies that hit these mistakes early sometimes conclude that “automation doesn’t work for us” and revert to manual reporting entirely — missing out on the time savings and consistency automation genuinely delivers once set up properly.

Consequently, the seven mistakes above aren’t really about GA4 or automated client reporting specifically. They’re about the universal risk of moving fast through a setup process that rewards a little patience upfront. Therefore, treating the first client as a genuine pilot — not a full launch — is the single habit that prevents nearly every problem on this list.

What a careful first rollout looks like: Specifically, agencies that automate one client first, verify the data thoroughly, and only then expand typically report a smooth transition with zero client-facing issues. Furthermore, by the third or fourth client, the setup process takes under thirty minutes because the template, branding, and review workflow are already established. Consequently, the careful path isn’t actually slower — it just avoids the crisis that comes from rushing.

Get GA4 automated reports right the first time

RaiseReturn connects to GA4, Google Ads, Meta Ads, Search Console, and PageSpeed — with built-in data verification and a structured review step before every report reaches a client. Automated client reporting done properly, from day one. First 30 days free, no card required.

Start Your Free Trial →

Common Questions About GA4 Automated Reports and Automated Client Reporting

What is the most common mistake when setting up GA4 automated reports?
The most common mistake when setting up GA4 automated reports is including too many metrics without prioritising which ones actually matter to the client’s business goals. Agencies new to automation often try to replicate every metric from their old manual reports, resulting in an automated report just as overwhelming as the manual one — just delivered faster. The fix is choosing four to six core metrics tied directly to business outcomes before building the automated template.
How long does it take to properly set up Google Analytics automated reports?
Setting up Google Analytics automated reports properly, including GA4 connection, conversion event verification, template configuration, and a test cycle, typically takes half a day to a full day per client the first time. Subsequent clients take significantly less time once the template and process are established, often under 30 minutes per additional client.
Why do GA4 automated reports sometimes show incorrect data?
GA4 automated reports show incorrect data most often because of misconfigured conversion events, unverified data streams, or comparing mismatched date ranges. These issues usually stem from the underlying GA4 property setup rather than the automation tool itself. Running a data validation check against the GA4 interface before the first automated report goes to a client catches the vast majority of these discrepancies early.
Should automated client reporting completely replace manual reports?
Automated client reporting should replace the production and data-collection work behind manual reports, but not the human review step. The most effective approach uses automation to handle data collection, formatting, and first-draft narrative generation, while an account manager reviews and adds client-specific context before every report goes out. Fully unreviewed automation risks sending reports with errors or missing context that only a human would catch.

Specifically, none of these seven mistakes are complicated once you know to look for them. Furthermore, they’re the same mistakes agency after agency makes independently, simply because moving fast feels productive and checking feels slow.

Slow down for fifteen minutes. Save yourself the awkward email later.

Looker Studio Templates for Agencies: What They Get Right, What They Miss, and When You’ve Outgrown Them

Looker Studio templates get recommended constantly. Free, flexible, backed by Google. However, “free and flexible” doesn’t always mean “right for your agency” — and plenty of agencies discover that the hard way, usually around client number twelve.

Let’s actually break this down honestly.

Specifically, Looker Studio — the tool most people still call Google Data Studio out of habit — is genuinely useful. Furthermore, the template ecosystem around it has grown substantially, offering pre-built dashboards for nearly every platform and use case. Consequently, it’s often the first stop for agencies trying to look professional without building a reporting system from scratch. Therefore, this isn’t a takedown. It’s an honest look at where templates genuinely help, and where they quietly start costing you more than they save.

What Looker Studio Templates Actually Are

Specifically, Looker Studio templates are pre-built dashboard layouts that connect to data sources — GA4, Google Ads, Meta Ads, Search Console — through configured connectors. Furthermore, instead of designing a dashboard from a blank canvas, you copy a template, swap in your own data source, and adjust the branding. Consequently, what would take hours to build from scratch takes minutes to configure.

Google Data Studio rebranded to Looker Studio in 2022, following its closer integration with Google’s Looker business intelligence platform. Furthermore, the core product and template ecosystem carried over largely unchanged through that transition. Consequently, “Google Data Studio templates” and “Looker Studio templates” refer to essentially the same thing — most people just haven’t updated the terminology in their search habits yet.

Why agencies reach for templates first

“When we started, we had three clients and no budget for a proper reporting tool. Someone recommended a free Looker Studio template for GA4 and Google Ads. Took maybe twenty minutes to set up. Looked genuinely professional. We used it happily for the first year — it did exactly what we needed at that size.”

Free
Cost of most Looker Studio templates — a major draw for small agencies
20 min
Typical setup time for a single-client Looker Studio template
10-15
Client count where most agencies start hitting real template limitations

What Looker Studio Templates Genuinely Get Right

Specifically, credit where it’s due — Looker Studio templates solve real problems for agencies at a certain size, and dismissing them entirely would be dishonest. Furthermore, understanding exactly what they do well helps you decide if they’re still the right fit for your agency today.

Genuinely Good Fit For
  • Freelancers and solo consultants with 1-5 clients
  • Agencies just starting out with limited budget
  • Internal team dashboards, not client-facing reports
  • Simple single-platform reporting needs
  • Teams comfortable with occasional manual troubleshooting
  • Clients who actively enjoy exploring live data themselves
Where It Starts Breaking Down
  • Agencies managing 10+ clients across multiple platforms
  • Teams needing consistent narrative explanations, not just charts
  • Clients who don’t understand raw data without context
  • Reports requiring true white label branding at scale
  • Situations where connector reliability really matters
  • Agencies without a dedicated person to maintain dashboards

Specifically, the free price point alone makes Looker Studio templates worth trying for any agency in the early stages. Furthermore, the visual quality of well-designed templates genuinely rivals paid tools. Consequently, if your agency fits the left-hand column above, templates are a completely reasonable choice — not a compromise.

Where Looker Studio Templates Break Down at Scale

Specifically, the honest problems with Looker Studio templates rarely show up in week one. Furthermore, they show up gradually, as client count grows and the maintenance burden compounds. Therefore, understanding these limitations in advance helps you plan for the transition before it becomes a crisis.

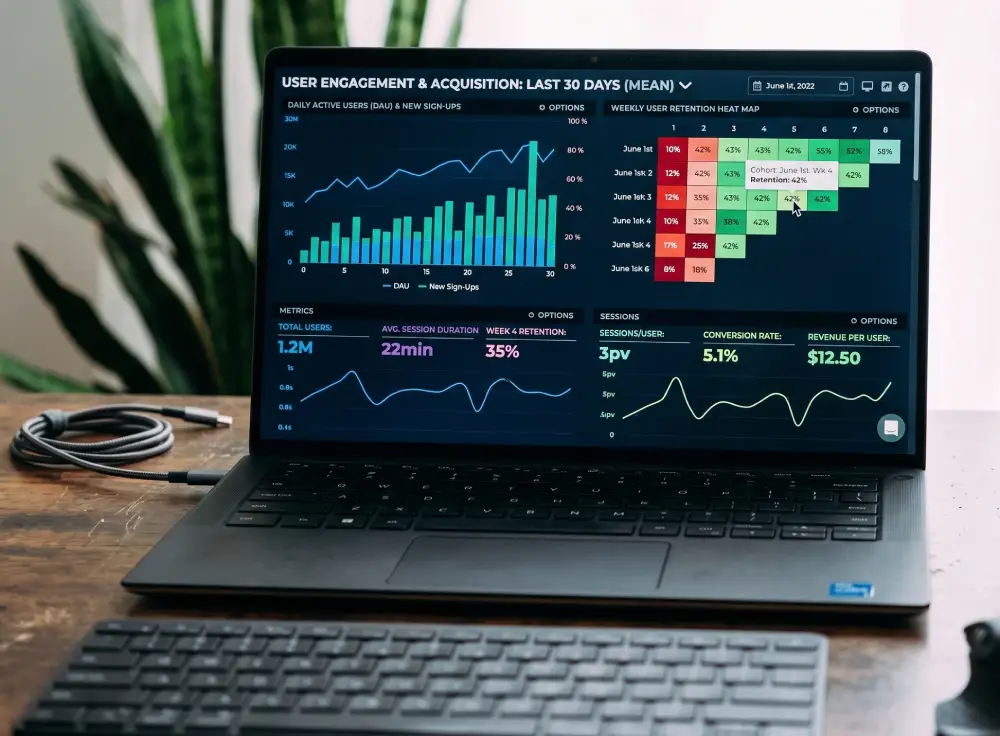
Marketing dashboard template comparison showing Looker Studio limitations versus automated client reporting

Looker Studio templates work well at small scale, but connector maintenance and narrative gaps compound as an agency’s client roster grows.

Connectors break without warning

Specifically, third-party connectors — especially for Meta Ads and some Google Ads configurations — can break silently when platforms update their APIs. Furthermore, a client might view a dashboard showing stale or missing data for weeks before anyone notices.

Data without narrative confuses clients

Consequently, a live chart showing conversion trends means little without someone explaining what drove the change. Furthermore, most templates present numbers beautifully but offer zero context — leaving clients to interpret data they’re not trained to read.

Real customisation takes real time

Specifically, making a generic template feel genuinely client-specific — proper branding, relevant metrics only, sensible layout for that client’s goals — takes meaningfully longer than the “20-minute setup” templates advertise. Moreover, that time repeats for every new client.

Maintenance grows faster than client count

Furthermore, ten dashboards mean ten places where a connector can break, a metric can drift, or a layout can need updating. Consequently, maintenance overhead grows non-linearly — doubling clients often more than doubles the upkeep burden.

“A dashboard is not a report. A dashboard shows what happened. A report explains why it happened and what you’re doing about it. Templates are excellent at the first job and completely silent on the second.”

The Core Gap — Data Display vs Client Communication

Specifically, this is the distinction that matters most and gets overlooked most often. Furthermore, Looker Studio templates are fundamentally a data visualisation tool — they excel at displaying numbers clearly. However, they weren’t built to communicate meaning, and that’s a genuinely different job.

Consequently, a client who opens a beautifully designed Looker Studio dashboard still has to answer the question themselves: is this good or bad? Furthermore, most business owners aren’t equipped to answer that confidently from a chart alone. Therefore, the agency ends up fielding “what does this mean?” calls anyway — which defeats much of the time-saving purpose the template was meant to provide in the first place.

The self-serve dashboard trap: Specifically, many agencies assume a live dashboard reduces client questions because clients can “check anytime.” Furthermore, in practice, most clients rarely log in — and when they do, they often misinterpret a normal fluctuation as a problem. Consequently, self-serve access sometimes generates more confused, anxious client emails than a well-written monthly report would have prevented entirely.

Signals You’ve Outgrown Looker Studio Templates

Specifically, there’s no universal client count where templates stop working — it depends on team capacity, client sophistication, and how many platforms you’re reporting on. Furthermore, the table below maps the most common signals against what they typically indicate.

Signal What It Usually Means Recommendation
Fewer than 8 clients, one platform eachTemplates are still efficient and low-maintenanceStay
Spending 2+ hours weekly on connector fixesMaintenance overhead is exceeding the time savedMove On
Clients regularly ask “what does this mean?”Data display without narrative isn’t serving clientsMove On
10+ clients across 3+ platforms eachManual customisation no longer scales sustainablyMove On
Clients rarely log in to check dashboardsSelf-serve format isn’t matching client behaviourMove On
Team has dedicated dashboard maintenance timeOverhead is managed and templates remain viableStay

Specifically, if most rows in your honest self-assessment land in “Move On,” that’s not a failure of your agency — it’s a natural outgrowing of a tool that served its purpose at an earlier stage. Furthermore, plenty of successful agencies started exactly where you are now.

What a Purpose-Built Alternative Actually Solves

Specifically, the honest alternative to Looker Studio templates isn’t a “better template” — it’s a fundamentally different approach that combines data collection, narrative generation, and branded delivery into one automated system. Furthermore, purpose-built tools like RaiseReturn address each limitation templates have directly.

Consequently, instead of a live dashboard requiring interpretation, you get a monthly report that arrives with the interpretation already written — an AI-generated summary explaining what happened and why, reviewed by your account manager before delivery. Moreover, instead of managing individual connector reliability yourself, the platform handles API authentication, token refresh, and error handling centrally across all your clients. Therefore, adding a new client takes minutes of OAuth setup rather than hours of dashboard customisation.

It’s not about replacing dashboards entirely

Specifically, some clients genuinely benefit from live dashboard access alongside their monthly report — particularly sophisticated, data-comfortable clients who like to explore. Furthermore, the point isn’t eliminating dashboards. It’s recognising that most clients need the narrative report as the primary deliverable, with a dashboard as an optional supplement rather than the main communication tool.

The transition doesn’t have to be dramatic: Specifically, agencies moving from Looker Studio templates to automated reporting typically run both in parallel for one reporting cycle before fully switching. Furthermore, this lets the team compare quality and time investment directly, building confidence before retiring the old system. Consequently, the switch feels evolutionary rather than risky — a natural next step rather than a leap of faith.

Ready for reports that explain themselves?

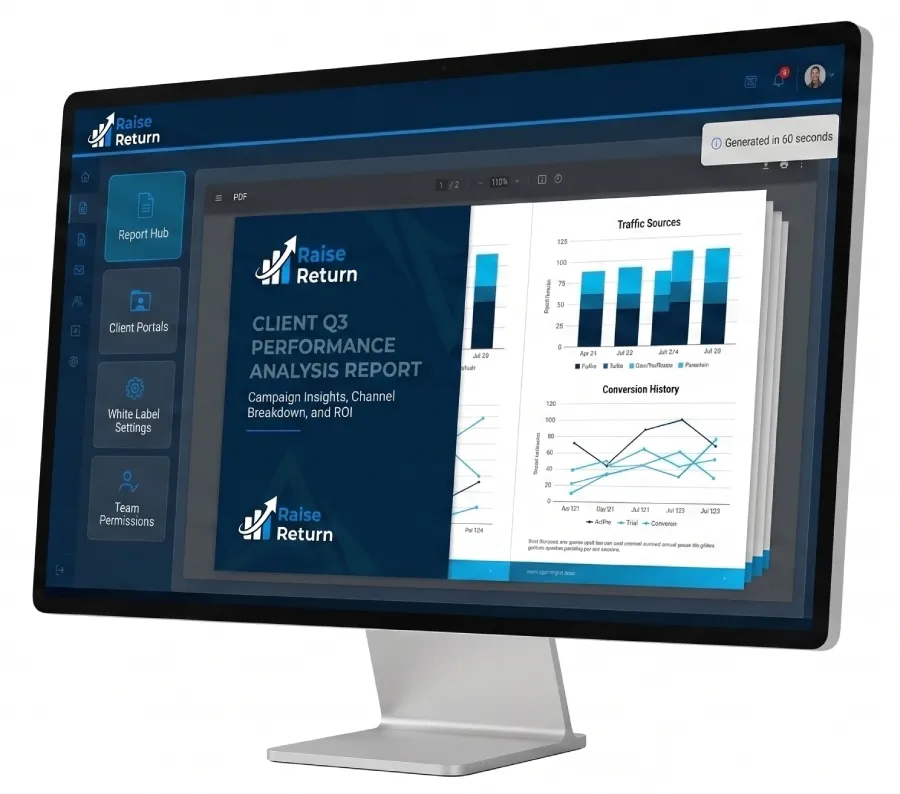
RaiseReturn connects to GA4, Google Ads, Meta Ads, Search Console, and PageSpeed — generating fully branded, AI-written reports in under 60 seconds. No connector maintenance. No blank charts waiting for interpretation. First 30 days free, no card required.

Start Your Free Trial →

Common Questions About Looker Studio and Google Data Studio Templates

What are Looker Studio templates used for?
Looker Studio templates are pre-built dashboard layouts that connect to data sources like Google Analytics, Google Ads, and Meta Ads, letting agencies quickly build client-facing reports without designing a dashboard from scratch. They’re commonly used to save setup time, provide a starting visual structure, and give smaller agencies or freelancers a free way to present marketing data. Templates range from single-platform dashboards to multi-channel marketing overviews.
Is Google Data Studio the same as Looker Studio?
Yes. Google Data Studio was rebranded to Looker Studio in 2022 after Google integrated it more closely with its Looker business intelligence platform. The core product, connectors, and template ecosystem remained largely the same through the transition, so “Google Data Studio templates” and “Looker Studio templates” generally refer to the same category of pre-built dashboards, just under the platform’s current name.
What are the limitations of Looker Studio templates for agency reporting?
The main limitations of Looker Studio templates for agency reporting include limited narrative context (they show data without explaining what it means), connector reliability issues that can break reports without warning, a live-dashboard format that requires clients to log in and interpret data themselves, and significant manual customisation time required to make a generic template feel genuinely client-specific. They also don’t scale well past a handful of clients without considerable ongoing maintenance.
When should an agency move on from Looker Studio templates?
An agency should consider moving on from Looker Studio templates when connector maintenance starts consuming significant time each month, when client feedback suggests the dashboards are confusing rather than clarifying, or when the agency manages enough clients that manually customising and troubleshooting templates no longer scales. At that point, purpose-built automated reporting tools that combine data collection, narrative generation, and branded delivery typically offer a more sustainable path.

Specifically, Looker Studio templates aren’t a mistake — they’re a genuinely useful starting point that plenty of successful agencies have used well. Furthermore, the mistake is staying with them past the point where they’re actually serving your clients and your team. Consequently, the question isn’t whether templates are good or bad. It’s whether they’re still right for the agency you’ve become.

Know when a tool served its purpose. Then move forward.

Why Your Google Ads Data Never Makes It Into Your Marketing Strategy — And How to Fix That

Google Ads holds some of the richest customer intent data any marketing channel produces. Search terms show exactly what language people use when they’re ready to buy. However, most of that insight never leaves the campaign dashboard. It gets used to adjust bids and pause keywords — then it disappears.

That’s a strategic loss most agencies don’t even notice.

Specifically, the account manager running Google Ads knows which messaging converts, which audience segments respond, and which search terms signal real buying intent. Furthermore, none of that knowledge typically makes it into the quarterly strategy conversation, the content calendar, or the positioning decisions the wider marketing team makes. Consequently, agencies end up running two parallel operations — tactical campaign management and strategic planning — that barely talk to each other.

Why Google Ads Data Gets Trapped in Its Own Silo

Specifically, this disconnect isn’t a failure of intelligence or effort. Furthermore, it’s a structural consequence of how agencies typically organise reporting and strategy work. PPC specialists live inside the Google Ads interface daily — checking search terms, adjusting bids, testing ad copy. However, strategic planning happens monthly or quarterly, usually in a completely different meeting, often reviewing a summary report that strips out the granular detail that actually matters.

Consequently, by the time strategic conversations happen, the specific insight — the exact phrase a customer typed before converting, the particular objection an ad addressed successfully — has already been abstracted into a single ROAS number. Therefore, the strategy team makes decisions based on outcomes without access to the reasoning behind them.

A pattern worth recognising

“Our Google Ads specialist found that search terms containing ‘same day’ converted three times better than anything else. She adjusted bids accordingly and moved on. It took me four months to find out — completely by accident in a random conversation — and once I knew, we rewrote our homepage headline around it. That insight sat in a spreadsheet for four months doing nothing for the wider marketing strategy.”

73%
of agencies say campaign-level insights rarely reach strategic planning conversations
4 months
Average delay between a PPC insight being discovered and reaching wider strategy
2.4×
Higher conversion rate when messaging incorporates proven Google Ads search term language

What Marketing Strategy Misses When Google Ads Stays Siloed

Specifically, the cost of this disconnect isn’t abstract. Furthermore, it shows up in concrete missed opportunities across the marketing function — decisions made without access to some of the clearest customer signal available.

When Google Ads Stays Siloed
  • Website copy ignores proven high-converting language
  • Content calendar misses topics search terms reveal as high-intent
  • Email messaging doesn’t reflect what actually converts in ads
  • Budget decisions happen without cross-channel context
  • Sales team lacks insight into what messaging pre-qualifies leads
  • Organic SEO strategy misses proven commercial keyword intent
When Google Ads Feeds Strategy
  • Website headlines mirror language proven to convert
  • Content plan prioritises topics with demonstrated buying intent
  • Email sequences reuse messaging themes that outperform
  • Budget shifts toward channels supporting proven demand signals
  • Sales conversations reference the exact pain points ads addressed
  • SEO targets commercial terms Google Ads data already validated

Specifically, none of the right-hand column requires new data. Furthermore, it requires the data that already exists inside the Google Ads account to travel somewhere it currently doesn’t go. Consequently, closing this gap is less about collecting more information and more about building a bridge for information that’s already been collected.

Four Types of Google Ads Insight That Should Shape Marketing Strategy

Specifically, not every piece of Google Ads data belongs in a strategy conversation. Furthermore, some insights are tactical and stay tactical — daily bid adjustments don’t need a board meeting. However, four specific categories of Google Ads insight carry strategic weight well beyond the paid search account itself.

Google Ads campaign data feeding into broader marketing strategy planning and decision making

Google Ads search term data reveals customer language and intent that should inform decisions well beyond the paid search account itself.

Search Term Language

Specifically, the exact phrases customers type before converting reveal how they think about the problem your client solves. Furthermore, this language often differs from how the business describes itself internally.

Apply to: website copy, ad headlines, content titles, email subject lines
Audience Segment Performance

Furthermore, which demographic, interest, or remarketing segments convert best reveals who the actual buyer is — sometimes different from who the client assumed. Consequently, this reshapes targeting across every channel.

Apply to: buyer personas, social media targeting, content audience strategy
Winning Ad Copy Themes

Specifically, ad copy that consistently outperforms reveals which value propositions, objections, or benefits resonate most. Moreover, this is direct evidence of messaging that works — not a guess.

Apply to: homepage messaging, sales scripts, case study framing
Seasonal and Timing Patterns

Consequently, Google Ads reveals exactly when demand rises and falls throughout the year — data that’s usually more granular and reliable than general market assumptions.

Apply to: budget planning, campaign launch timing, content calendar scheduling

“Google Ads isn’t just a channel you manage. It’s a live focus group running every day, telling you exactly what your customers want to hear — if anyone’s actually listening.”

Why This Disconnect Matters More at Scale

Specifically, the gap between Google Ads data and marketing strategy widens as agencies grow, not narrows. Furthermore, at three or four clients, the same person often manages both the campaigns and the strategic relationship — so insight naturally flows because it lives in one head. However, at fifteen or twenty clients, PPC specialists and account strategists are often different people, sometimes on different teams entirely.

Consequently, the structural distance between the person who sees the search term data daily and the person making strategic recommendations to the client grows with every additional client the agency signs. Therefore, without a deliberate process to bridge that gap, larger agencies actually extract less strategic value from their Google Ads data than smaller ones — despite having significantly more of it.

How to Build the Bridge Between Google Ads and Marketing Strategy

Specifically, closing this gap doesn’t require restructuring your team or hiring a dedicated insights analyst. Furthermore, it requires a consistent process that surfaces the right Google Ads data to the right people at the right cadence. Therefore, here’s a practical five-step approach that works regardless of agency size.

1

Review search terms monthly, not just for negative keywords

Specifically, most PPC specialists review search terms to find wasted spend and add negative keywords. Furthermore, add a second lens: which converting search terms reveal language or intent worth sharing with the wider team? Consequently, this single habit change surfaces most of the valuable insight without any additional tooling.

2

Include a strategic insight section in every client report

Furthermore, most Google Ads sections in client reports focus entirely on performance metrics — spend, conversions, ROAS. Specifically, add a short section explicitly asking: what did we learn this month that applies beyond the ads account? Consequently, this forces the insight to get written down and shared, rather than staying in the PPC specialist’s head.

3

Bring Google Ads data into quarterly strategy reviews directly

Specifically, don’t let quarterly strategy conversations rely purely on summary reports. Furthermore, pull in actual search term examples, winning ad copy, and audience performance data as source material for the discussion. Therefore, the strategy conversation grounds itself in real customer language rather than abstracted metrics.

4

Connect PPC and content or SEO planning explicitly

Furthermore, Google Ads search term data often reveals commercial keyword intent that organic content strategy should target. Specifically, schedule a recurring conversation — even quarterly — between whoever manages paid search and whoever manages content or SEO. Consequently, both channels reinforce each other instead of operating independently.

5

Centralise all channel data in one regular report

Specifically, when Google Ads data appears in the same report as GA4, Meta, and Search Console data — reviewed together, on the same cadence — patterns become visible that stay hidden when each platform gets reviewed in isolation. Furthermore, this structural change does more to surface cross-channel insight than any individual analytical effort.

The reporting cadence fix

Specifically, most of this bridge-building work fails not from lack of insight but from lack of a consistent forum where that insight gets shared. Furthermore, a monthly report that combines Google Ads with the rest of the marketing picture — rather than isolating it in its own document — creates that forum automatically. Consequently, insights that would otherwise stay trapped in a PPC specialist’s head get surfaced simply because the reporting structure requires it.

How Automated Reporting Naturally Closes the Gap

Specifically, one of the underappreciated benefits of automated, consolidated reporting is that it structurally forces cross-channel visibility. Furthermore, when Google Ads, GA4, Meta, and Search Console data all appear in the same document — reviewed by the same person, at the same time, every month — patterns connecting the channels become far easier to spot.

Consequently, an account manager reviewing a single automated report that shows Google Ads search term trends alongside GA4 landing page performance and organic search rankings will notice a converging theme far more readily than someone checking four separate platform dashboards on four separate occasions. Therefore, consolidated automated reporting doesn’t just save time — it actively improves the quality of strategic thinking by presenting the full picture in one place.

What this looks like in practice: Specifically, an agency using consolidated automated reporting notices that a particular messaging theme performs well in Google Ads. Furthermore, because that data sits in the same report as organic search performance, the account manager notices the same theme has weak organic visibility — a content gap. Consequently, that observation, which might never have surfaced from isolated platform checks, becomes a specific, actionable recommendation in the next strategy conversation.

See your Google Ads data alongside your entire marketing picture

RaiseReturn connects to Google Ads, GA4, Meta Ads, Search Console, and PageSpeed — pulling every channel into one branded, AI-written report. Stop losing strategic insight in isolated platform dashboards. First 30 days free, no card required.

Start Your Free Trial →

Common Questions About Google Ads and Marketing Strategy

How does Google Ads data inform marketing strategy?
Google Ads data informs marketing strategy by revealing which audience segments, keywords, and messaging actually convert into customers — insight that should shape budget allocation, content priorities, and channel investment beyond paid search alone. When Google Ads performance data stays isolated in campaign dashboards instead of feeding into broader strategic reviews, agencies miss the chance to apply search intent insights to organic content, email messaging, and overall positioning.
Why do agencies struggle to connect Google Ads results to marketing strategy?
Agencies struggle to connect Google Ads results to marketing strategy because campaign optimisation and strategic planning often happen on different timelines, by different people, using different data views. PPC specialists focus on daily bid adjustments and quality scores, while strategic reviews happen monthly or quarterly using summary reports that strip out the granular insight that actually drives strategy. Without a structured process to surface Google Ads learnings into strategic conversations, valuable data gets trapped in the platform.
What Google Ads metrics matter most for marketing strategy decisions?
For marketing strategy decisions, the Google Ads metrics that matter most are search term insights showing what language customers actually use, conversion rate by audience segment, cost per acquisition trends over time, and which ad messaging themes consistently outperform others. These metrics reveal customer intent and positioning insight that should influence decisions well beyond the Google Ads account itself, including website copy, content strategy, and even product positioning.
How can automated reporting help connect Google Ads to marketing strategy?
Automated reporting helps connect Google Ads to marketing strategy by consistently surfacing campaign insights in a format decision-makers actually review, rather than leaving that data buried in a platform interface only the PPC specialist checks. When Google Ads performance appears alongside GA4, Meta, and organic search data in one regular report, patterns become visible that would otherwise stay siloed within individual platform dashboards.

Specifically, Google Ads generates some of the most valuable customer insight any marketing channel produces — and most of it never leaves the platform. Furthermore, fixing that isn’t about running better campaigns. It’s about building the structural bridge that lets existing insight travel to where strategic decisions actually get made.

Stop optimising in isolation. Start listening to what the data’s already telling you.

Why Your Digital Marketing and Social Media Reports Are Losing You Clients — And How to Fix It

Most agencies run genuinely solid digital marketing campaigns. The targeting is sharp. The social media content connects. The ad spend is managed responsibly. However, the clients don’t know any of that — because the monthly report doesn’t tell them.

That gap is where churn begins.

Specifically, a digital marketing report that lists impressions, reach, and click-through rates without explaining what those numbers mean for the business isn’t a report. Furthermore, it’s a data export with a logo on the front. Consequently, clients who can’t interpret what they’re reading start doubting whether the work is actually producing anything — and that doubt compounds quietly until they start looking for a different agency.

The Reporting Disconnect That Costs Agencies Real Money

Specifically, digital marketing agencies produce two types of output every month. The first type is the actual work — campaigns optimised, social media content published, budgets managed, audiences refined. Furthermore, this is where most agencies invest their expertise and attention, which makes complete sense. However, the second output is the communication layer — the report that explains what happened and why. Moreover, most agencies treat this as an afterthought rather than a deliverable.

Consequently, clients receive polished campaigns and confusing reports. Therefore, they trust the agency less than the results warrant — because the results are never communicated in a way they can actually understand or share internally.

What a confused client actually does

“My agency sends me a PDF every month. It’s about twenty pages. I scroll through it, see a lot of graphs, and then look for one number that tells me if things are going up or down. I usually can’t find it. So I forward the whole thing to my business partner and say ‘does this look right to you?’ Neither of us really knows.”

71%
of clients say digital marketing reports don’t help them make business decisions
Month 4
Average point when reporting confusion converts into active churn consideration
Higher client renewal rate at agencies sending clear, outcome-focused reports consistently

Vanity Metrics vs Value Metrics — The Core Problem in Social Media Reporting

Social media reporting has a specific version of this problem. Specifically, social platforms surface numbers that look impressive but rarely connect to business outcomes — and most agencies report those numbers without questioning whether clients actually need them.

Furthermore, reach and impressions sound meaningful. They’re large numbers. Consequently, they fill slides and make reports look substantial. However, a business owner who spent $2,500 on social media management last month doesn’t need to know their posts reached 84,000 people. They need to know whether those 84,000 people did anything useful — clicked through, enquired, purchased, or at minimum developed the kind of brand familiarity that influences future buying decisions.

Vanity Metrics — What Most Reports Lead With
  • Total reach and impressions
  • Raw follower count
  • Total likes and reactions
  • Post frequency and volume
  • Video views without context
  • Gross engagement (total interactions)
  • Story views without downstream tracking
Value Metrics — What Reports Should Lead With
  • Website clicks from social with UTM attribution
  • Conversion rate of social traffic
  • Leads or enquiries attributed to social
  • Cost per result (paid social only)
  • Engagement rate vs industry benchmark
  • Revenue or goal value from social channel
  • Share of voice vs competitors (where trackable)

Specifically, the fix here isn’t eliminating reach and impressions entirely — they matter for context. Furthermore, the fix is ensuring they never lead the report. Consequently, when a report opens with “your posts reached 84,000 people and drove 312 website visits, 18 of which completed an enquiry form,” the client understands both the scale and the outcome in a single sentence. Therefore, value metrics give vanity metrics meaning rather than replacing them.

Why Digital Marketing Reporting Breaks at Scale

Specifically, the reporting problem gets dramatically worse as an agency grows. Furthermore, managing five clients manually is exhausting but achievable. Managing fifteen or twenty clients with the same manual process means someone is always finishing a report late, writing a rushed summary, or copying a paragraph from last month’s report and updating the numbers. Consequently, quality degrades precisely at the moment it should be improving.

Moreover, digital marketing reports require data from multiple platforms — Google Analytics 4 for website performance, Google Ads for paid search, Meta Ads for paid social, Search Console for organic visibility, and the social media platforms themselves for organic social. Therefore, manually pulling, formatting, and reconciling data from five or six different sources for twenty clients every month isn’t a workflow — it’s a crisis that repeats on a 30-day cycle.

Digital marketing agency team reviewing social media and campaign performance data in automated client reports

When digital marketing and social media data flows automatically into one branded report, account managers spend their time on strategic analysis rather than platform exports.

The platform-hopping problem

Specifically, every digital marketing platform speaks its own language. Furthermore, Meta calls conversions “results.” Google Ads calls them “conversions.” GA4 calls them “conversion events.” Consequently, a client who receives data from three platforms without a normalised narrative ends up with three different words for the same concept — and often three different numbers that don’t add up, because attribution overlap isn’t explained. Therefore, the confusion clients experience isn’t stupidity. It’s a direct consequence of agencies forwarding raw platform data instead of translating it.

The attribution conversation nobody wants to have: Specifically, a client who sees 40 conversions reported in Google Ads and 35 in Meta Ads and 28 in GA4 for the same month will ask why the numbers don’t match. Furthermore, that conversation takes thirty minutes to explain and leaves the client uncertain even after the explanation. Consequently, an automated digital marketing report that addresses attribution methodology proactively — in plain English, before the client asks — eliminates that uncertainty entirely.

How to Structure the Social Media Section of a Digital Marketing Report

Specifically, social media reporting needs its own structured section in any digital marketing report — but most agencies either give it too much space (pages of screenshot grids) or too little (three lines buried in a general performance summary). Furthermore, the right approach sits between those extremes. Consequently, here’s what each major social platform’s section should cover and what to actively skip.

Meta (Facebook + Instagram)
Report: spend, CPL or CPR, reach, top-performing creative

Specifically, paid Meta performance lives and dies by cost per result. Furthermore, show spend vs the previous month, results achieved, and cost per result with a MoM comparison. Moreover, include the top-performing ad creative with a brief note on why it outperformed.

Skip: raw impressions, story views without conversion data, follower changes from organic
LinkedIn
Report: engagement rate, leads generated, ad performance if running

Consequently, LinkedIn organic content often has lower reach but higher quality engagement. Therefore, report on engagement rate rather than raw numbers. Furthermore, if running LinkedIn Ads, show cost per lead against benchmark and the best-performing content format.

Skip: connection count changes, impressions without engagement context
Organic Social (All Platforms)
Report: engagement rate, website referral clicks, best content

Specifically, organic social’s primary value is brand presence and community. Furthermore, report on engagement rate against an industry benchmark rather than raw numbers. Moreover, show which content drove the most website clicks via UTM-tagged links. Consequently, the client understands what’s working creatively.

Skip: follower growth as a primary KPI, likes without engagement rate context
Paid Social Summary
Report: total paid social spend, total results, blended CPA

Furthermore, clients who run paid activity across multiple platforms need a blended view. Specifically, show total digital marketing spend on social, total results across all paid channels, and the blended cost per acquisition. Therefore, the client sees the combined efficiency — not just individual platform snapshots.

Skip: platform-level attribution debates in the report — address separately if needed

“Social media reporting isn’t about showing how much happened. It’s about showing whether any of it mattered to the business. Those are completely different documents.”

How to Fix Digital Marketing Reporting Without Rebuilding Everything

Specifically, the fix doesn’t require redesigning your entire agency process from scratch. Furthermore, it requires changing two things: what order information appears in the report, and how the narrative gets written. Consequently, the data can stay largely the same — it’s the structure and the story around it that transforms client comprehension.

1

Start with outcomes, not activity

Specifically, the first thing a client reads should answer “did digital marketing work this month?” Furthermore, that means leading with conversions, leads, revenue, or whatever business outcome the client cares about. Consequently, the reach figures, impression counts, and click-through rates become supporting evidence rather than the headline.

2

Translate every metric into plain English

Furthermore, every number should have a sentence explaining what it means for the client’s business — not a label, but an interpretation. Specifically, “engagement rate 4.2%” means nothing to most business owners. However, “4.2% engagement rate — nearly double the industry average for your sector — means your audience is genuinely interested in what you post” means something real.

3

Include month-over-month comparison on every key metric

Specifically, numbers without context are almost useless for client communication. Furthermore, every key digital marketing metric in the report should show the current period figure alongside the previous month’s figure and the percentage change. Consequently, clients immediately understand whether performance is improving or declining — without needing to remember last month’s numbers themselves.

4

Add an honest wins and challenges section

Furthermore, this is the section most agencies skip — especially in difficult months. However, it’s the section that builds the most trust. Specifically, naming a challenge directly and explaining what the agency is doing about it demonstrates genuine accountability. Consequently, clients who feel honestly informed stay longer than clients who receive carefully managed positive framing.

5

Close with three specific next-month actions

Specifically, a report that ends with the previous month’s data leaves the client looking backward. Furthermore, one that ends with “here’s exactly what we’re doing next month and why” leaves them looking forward. Consequently, the relationship feels active rather than retrospective — and clients who feel a sense of forward momentum renew at significantly higher rates.

The Automation Layer That Makes This Sustainable

Specifically, knowing what a good digital marketing report looks like is half the problem. Furthermore, producing that quality consistently across fifteen or twenty clients every month — without the team burning out in the last week of every month — requires automating the production layer.

Consequently, when data collection, formatting, and first-draft narrative generation happen automatically, account managers have something genuinely different to do in month-end: review and improve rather than build from scratch. Therefore, the quality of thinking in the report goes up — because the person responsible for it arrives at the report with energy left over for thinking, rather than depleted from formatting.

What automation changes about the role

Specifically, an account manager using automated digital marketing reporting doesn’t stop doing strategic thinking — they start doing more of it. Furthermore, instead of spending four hours pulling social media data and reformatting GA4 exports, they spend fifteen minutes reviewing an AI-written draft and adding the specific insights only they know from client conversations. Consequently, the report gets better because the person reviewing it has capacity to actually think about the client’s business.

What an automated digital marketing report pipeline looks like

Specifically, the automation connects to GA4, Google Ads, Meta Ads, and Search Console via API — one connection per client platform, set up once. Furthermore, data pulls on a defined schedule at the end of each reporting period. Moreover, an AI system reads the normalised data and writes the first draft of the executive summary, the channel performance summaries, and the wins and challenges section. Therefore, the account manager opens a finished draft rather than a blank page — and fifteen minutes of review produces a better report than four hours of manual construction.

The time maths at scale: Specifically, at fifteen clients, manual digital marketing reporting typically consumes 60 to 75 hours per month across the team. Furthermore, with automated reporting in place, that drops to roughly 15 hours of review time. Consequently, the team recovers 45 to 60 hours every single month — hours that go directly into campaign work, client strategy, and the kind of proactive thinking that actually drives better results and longer retentions.

Automate your digital marketing and social media reports — in one branded document

RaiseReturn connects to GA4, Google Ads, Meta Ads, Search Console, and PageSpeed. It pulls all your digital marketing and social media data automatically and generates a fully branded, AI-written report in under 60 seconds. First 30 days free, no card required.

Start Your Free Trial →

Common Questions About Digital Marketing and Social Media Reporting

What should a digital marketing report include?
A strong digital marketing report should include a plain-English executive summary, key performance metrics with month-over-month comparisons, channel-level breakdowns covering paid search, social media, organic search, and email, an honest wins-and-challenges section, and a forward-looking next-month plan with specific actions. Every metric should connect to a business outcome the client cares about — not just platform statistics that look impressive but don’t tell the real story.
How should agencies report on social media performance?
Agencies should report on social media performance by separating organic and paid results clearly, leading with business outcomes rather than vanity metrics, including engagement rate rather than raw engagement numbers, and connecting social media activity to website traffic and conversions via properly tagged UTM parameters. The social media section of a report should answer one question: is this activity driving real business results, and is the investment justified?
What digital marketing metrics matter most to clients?
The digital marketing metrics that matter most to clients are the ones that connect directly to revenue or business growth: leads generated, cost per lead, revenue attributed to digital channels, website conversion rate, and return on ad spend. Platform-specific metrics like reach, impressions, and click-through rate matter internally but should always appear in reports alongside their business outcome equivalent, not as standalone numbers without context.
How do agencies automate digital marketing and social media reports?
Agencies automate digital marketing and social media reports by connecting to platform APIs — Google Analytics 4, Google Ads, Meta Ads, and Search Console — via a reporting tool that pulls data on a schedule, formats it consistently, generates AI-written narrative summaries, and delivers the finished report to clients automatically. The account manager reviews the draft before delivery rather than building the report from scratch, typically saving three to five hours per client per month.

Specifically, the quality of a digital marketing campaign and the quality of the report that describes it are both completely within an agency’s control. Furthermore, most agencies invest heavily in the first and almost nothing in the second. Consequently, they run great campaigns for clients who never fully understand how good the work actually is — and eventually leave for an agency whose reports, however mediocre the campaigns, at least make sense.

Run better campaigns. Tell the story better. Keep the clients longer.

How to Automate Google Analytics 4 Reports — The Complete Agency Guide to Automated Marketing Dashboards

GA4 is one of the most powerful analytics platforms marketers have ever had access to. It’s also one of the most frustrating to pull reports from manually. Specifically, if you manage more than five clients, you already know the feeling — navigating between property views, setting date ranges, exporting data that formats strangely, and rebuilding the same charts every single month.

It compounds fast. Really fast.

Furthermore, the irony of GA4 is that it contains exactly the data your clients need to understand their performance — but the interface wasn’t designed for client communication. Consequently, the gap between “data exists in GA4” and “client understands what that data means” is where most agencies burn their hours. Therefore, learning how to automate Google Analytics 4 reports is the single highest-leverage operational change most agencies can make — and it’s more achievable than most teams assume.

Why Manual GA4 Reporting Burns More Hours Than You Think

Specifically, GA4 requires familiarity before it feels intuitive. However, even for experienced users, pulling monthly client data manually involves far more steps than it should. Furthermore, navigating to the right report, setting the date range to last month, switching to a custom comparison, waiting for data to load, and then exporting in a format that requires reformatting — that process repeats for every metric, every channel, and every client.

Consequently, what feels like “just pulling some numbers” is often an hour-long process per client. Moreover, at fifteen clients, that’s fifteen hours of data collection before a single word of narrative gets written. Therefore, the month-end crunch isn’t caused by having too many clients — it’s caused by a workflow that was never designed to scale.

What this actually sounds like

“I spent forty minutes on Tuesday just trying to get GA4 to show me the right session data for one client. The date range kept reverting. Then the channel grouping didn’t match what I’d reported last month. By the time I had the right numbers, I could have written the entire executive summary in that time.”

2h
Average time to manually pull and format GA4 data for one client per month
30h
Monthly GA4 data collection time at a 15-client agency without automation
60s
Time to generate a complete GA4-powered automated report with RaiseReturn

The GA4-Specific Pain Points That Manual Reporting Creates

Specifically, GA4 introduced several changes from Universal Analytics that made manual reporting harder — not easier. Furthermore, understanding these friction points explains exactly why automating Google Analytics 4 reports produces such a significant time saving.

Session definitions changed — and clients get confused

Specifically, GA4 defines sessions differently from Universal Analytics. Furthermore, clients who remember their old session numbers see new figures and assume something broke. Consequently, account managers spend time explaining a methodology change rather than discussing performance.

Automated reports include plain-English context alongside metrics — no more methodology calls.
No bounce rate — engagement rate replaces it

Furthermore, GA4 replaced bounce rate with engagement rate, which measures the opposite. Consequently, clients who track their own dashboards often ask why bounce rate disappeared. Therefore, manual reports need a paragraph of explanation every single month until clients fully adapt.

Automated marketing dashboards define metrics once and apply the explanation consistently across all clients.
Date comparison requires extra navigation steps

Specifically, setting a month-over-month comparison in GA4 requires several additional clicks that aren’t obvious. Moreover, the default view doesn’t show comparisons — you have to activate them manually. Consequently, account managers who forget this step export data without MoM context and have to start over.

Automated GA4 reports apply MoM comparisons automatically to every metric on every report.
Channel groupings vary between properties

Furthermore, GA4 channel groupings aren’t always consistent across client properties — especially when UTM parameters weren’t set up uniformly. Consequently, “Organic Social” for one client might appear differently in another’s GA4. Therefore, manual reporting requires checking channel groupings per client before exporting data.

Automated reporting normalises data across all clients into a consistent channel structure before building the report.

Automated Marketing Dashboards vs Automated Reports — What’s the Difference?

Specifically, this distinction matters more than most agency owners realise — and choosing the wrong approach for the wrong audience wastes everyone’s time. Furthermore, automated marketing dashboards and automated GA4 reports serve genuinely different purposes, even when they pull from the same data.

Live Automated Dashboard
  • Shows live, real-time data — always current
  • Requires the client to log in and navigate
  • No narrative context — just numbers and charts
  • Best for clients who actively monitor their own data
  • Doesn’t prompt action — shows what’s happening now
  • Risk: clients misinterpret data without guidance
Automated Monthly Report
  • Pulls data on a set schedule — consistent snapshot
  • Delivered directly to the client’s inbox
  • AI-written summaries explain what the data means
  • Best for most clients — especially non-technical ones
  • Prompts confidence and forward action
  • Branded white label output — your agency, not the tool

Specifically, most agency clients benefit more from automated monthly reports than from live dashboards. Furthermore, live dashboards require clients to visit a platform, understand what they’re looking at, and interpret changes in context — which is exactly what they hired the agency not to have to do. Consequently, a beautifully built automated marketing dashboard that nobody logs into doesn’t retain clients. However, a clear, branded automated report that lands in the inbox every month on the same date does.

Automated Google Analytics 4 reports and marketing dashboards showing clean branded client reporting output

Automated GA4 reports bring the data to the client — rather than asking the client to come find the data in a platform they don’t fully understand.

What GA4 Metrics to Include in Automated Client Reports

Specifically, the most common mistake agencies make when building automated marketing dashboards is including too many GA4 metrics. Furthermore, more data doesn’t mean more clarity — it often means less. Consequently, the automated reports that clients actually read and remember are the ones structured around a small set of metrics that map directly to business outcomes.

GA4 Metric What It Tells the Client Priority
Sessions (with MoM comparison)How many times people visited — and whether it’s growingEssential
Conversions by channelWhich traffic sources are producing actual resultsEssential
Conversion rateWhether the website turns visitors into customers effectivelyEssential
Engagement rateWhether visitors are genuinely interacting with contentEssential
Top landing pages by conversionsWhich pages drive the most business outcomesEssential
Revenue / goal valueDirect business impact of website trafficEssential
Average engagement time per sessionQuality of attention the site receivesOptional
New vs returning usersWhether the site builds an audience over timeOptional
Events by typeWhich micro-conversions happen most frequentlyOptional

Furthermore, every metric in an automated GA4 report should appear with its month-over-month change — not just the raw number. Specifically, “14,820 sessions” is almost meaningless to a business owner without context. However, “14,820 sessions, up 12.4% from last month” immediately communicates performance direction. Consequently, the comparison arrow does as much work as the number itself.

“GA4 gives you more data than any previous analytics platform. The agency’s job is to turn that data into a sentence the client can act on — not to forward the export.”

How to Automate Google Analytics 4 Reports — Step by Step

Specifically, automating GA4 reports without building custom infrastructure requires a purpose-built reporting tool that connects to the Google Analytics Data API on your behalf. Furthermore, the process looks almost identical whether you manage five clients or fifty. Therefore, here’s the practical sequence from connection to delivery.

1

Connect each client’s GA4 property via OAuth

Specifically, this is a one-time authentication step per client — you grant the reporting tool read access to the GA4 property. Furthermore, you don’t need to share login credentials or change any GA4 settings. Consequently, the tool reads data directly from the API without touching anything inside the client’s Google Analytics account.

2

Select your metrics and dimensions

Furthermore, choose which GA4 metrics you want to include in the automated report — sessions, conversions, engagement rate, revenue, and so on. Specifically, most reporting tools offer a standard template that covers the essentials. Consequently, you can customise per client if they have specific metrics they care about, or apply the same template across all accounts for consistency.

3

Configure your branded white label template

Specifically, upload your agency logo, set your brand colours, and define the section structure you want every report to follow. Furthermore, this configuration applies automatically to every GA4 report the system generates. Consequently, every client receives a polished, branded document — not a raw data export.

4

Set the delivery schedule

Specifically, define when reports generate and when they deliver — for most agencies, the last day of the month for generation and the 1st or 2nd for delivery. Furthermore, the system handles the data pull, report build, and email delivery automatically on that schedule. Therefore, no manual trigger is required from the account manager on reporting day.

5

Review the AI-written draft before delivery

Specifically, automated GA4 reports generate an AI-written summary of the month’s performance — what moved, why it moved, and what the agency is doing about it. Furthermore, the account manager reviews this draft in ten to fifteen minutes, adds any client-specific context, and approves. Consequently, the final report sounds like a human wrote it — because a human reviewed it.

The review step matters

Specifically, the best automated GA4 reports aren’t fully hands-off — they include a structured human review before delivery. Furthermore, the AI generates the data summary and the first draft of every narrative section. However, the account manager adds the layer of relationship context that the system can’t know — what the client mentioned on their last call, a campaign test that just launched, an industry event that affected traffic. Consequently, the report reads like genuine expertise, not a machine output.

What Good Automated Marketing Dashboards Look Like for Agency Clients

Specifically, the word “dashboard” means different things to different people. Furthermore, for agency clients — most of whom are business owners, not marketers — a good automated marketing dashboard isn’t a live interface full of filters. It’s a monthly document structured like a conversation: here’s where you were, here’s where you are now, here’s what changed, and here’s what we’re doing about it.

Consequently, the most effective automated marketing dashboards for agencies follow a clear structure that doesn’t change between months. Moreover, clients who receive the same layout every month start reading faster because they know exactly where to look for the information they want. Therefore, structural consistency isn’t a limitation — it’s a feature that makes the dashboard more useful over time.

The structure that works across all client types

Specifically, effective automated marketing dashboards for agencies open with an executive summary of four sentences or fewer. Furthermore, this summary sits above any data and answers the only question every client reads the report to find out: was this month good or bad, and why? Consequently, a client who only reads the first paragraph still leaves informed — which is what a good dashboard achieves.

Moreover, following the executive summary, a key metrics snapshot shows four to six numbers with month-over-month comparison arrows. Specifically, each number includes a one-sentence plain-English translation below it — not a label, but an interpretation. Therefore, “14,820 sessions (+12.4%)” followed by “More people visited your website this month than any month since April” tells a story that raw data alone never does.

What clients remember from automated marketing dashboards: Specifically, research into how non-technical clients read reports shows that most remember one or two things after their first read. Furthermore, what they remember is almost always the summary paragraph and the biggest single number change — positive or negative. Consequently, automated dashboards that lead with clear narrative capture that attention before the data even loads. Therefore, invest in the summary as much as the data presentation itself.

Combining GA4 With Other Channels in One Automated Dashboard

Specifically, GA4 alone tells part of the story. Furthermore, most agency clients need a complete picture — what happened on the website alongside what happened in paid search, paid social, and organic search. Therefore, the most valuable automated marketing dashboards for agencies pull GA4 data together with Google Ads, Meta Ads, and Search Console into a single branded document.

Consequently, clients receive one report with one narrative — not four separate platform exports that they’re expected to read and connect themselves. Moreover, when GA4 shows a conversion rate increase, the automated report can immediately attribute it to the Meta campaign that drove qualified traffic — because both data sources appear in the same document, in the same reporting cycle, with the same AI-written context connecting them. Therefore, the insight that previously required a follow-up call becomes self-evident from the report itself.

The fragmented dashboard problem: Specifically, many agencies build separate dashboards for each platform — a GA4 dashboard, a Google Ads dashboard, a Meta dashboard. Furthermore, clients receive three links and zero context connecting them. Consequently, they spend time trying to reconcile numbers between platforms they barely understand individually. Therefore, a single automated marketing dashboard that combines all channels with joined narrative is significantly more valuable than three isolated platform views.

Automate your GA4 reports — and every other channel — in one branded dashboard

RaiseReturn connects to GA4, Google Ads, Meta Ads, Search Console, and PageSpeed. It generates fully branded automated marketing dashboards with AI-written summaries in under 60 seconds. First 30 days free, no card required.

Start Your Free Trial →

Common Questions About Automating GA4 Reports and Marketing Dashboards

How do I automate Google Analytics 4 reports for clients?
To automate Google Analytics 4 reports for clients, you connect each client’s GA4 property to a reporting tool via the Google Analytics Data API, configure which metrics and dimensions you want to pull, set a delivery schedule, and let the system generate and send reports automatically. Tools like RaiseReturn handle the API connection, data normalisation, branded formatting, and scheduled delivery — so account managers review a finished draft rather than building a report from scratch each month.
What is the difference between a GA4 dashboard and an automated GA4 report?
A GA4 dashboard shows live data inside the Google Analytics interface — useful for internal monitoring but not designed for client communication. An automated GA4 report pulls that same data on a schedule, formats it with your agency branding, adds plain-English narrative summaries explaining what the numbers mean, and delivers it directly to the client. Dashboards require clients to log into a platform they may not understand. Automated reports bring the story to their inbox.
What GA4 metrics should agencies include in automated marketing dashboards?
For automated marketing dashboards, agencies should prioritise sessions with month-over-month comparison, conversions and conversion rate by channel, engagement rate, top traffic channels, top landing pages by conversion, and revenue or goal value where applicable. Every metric should include a plain-English explanation of what it means for the client’s business — not just the number itself. Raw GA4 exports confuse most clients; narrative-driven automated dashboards inform them.
Can agencies automate GA4 reports without technical knowledge?
Yes. Purpose-built tools like RaiseReturn connect to GA4 through a guided OAuth flow that requires no coding or API configuration from the agency. You connect the client’s property, select your metrics, configure your branded template, and set a delivery schedule. The tool handles data collection, formatting, AI-written summaries, and delivery automatically — no spreadsheets, no manual exports, no technical setup required.

Specifically, learning how to automate Google Analytics 4 reports isn’t about replacing the analyst. Furthermore, it’s about removing the production layer that stops analysts from doing analysis. Consequently, when the data pull, the formatting, and the first draft happen automatically, account managers spend their time on the part of reporting that actually requires their expertise — understanding the story behind the numbers and communicating it clearly.

Automate the build. Keep the thinking. That’s the whole point.

Why Automated Client Reporting and White Label Reports Are Your Agency’s Best Trust-Building Tool

Agencies pour serious money into campaigns. Hours go into keyword strategy, creative testing, audience segmentation, bid optimisation. However, the thing clients actually evaluate the agency on — the one touchpoint that lands in their inbox every single month — gets built in a rush at 11 PM by someone who ran out of time.

That’s the reporting paradox most agencies never resolve.

Specifically, clients cannot watch your campaigns in real time. They can’t see the A/B tests, the audience adjustments, the negative keywords getting refined. Furthermore, they can’t feel the strategic thinking happening behind the scenes. Consequently, what they can see — the only tangible proof they receive that your agency is doing its job — is the report. Therefore, the quality and consistency of that document shapes how they feel about your agency far more than the campaign itself does.

Why Most Agency Reports Quietly Damage Trust Instead of Building It

Here’s an uncomfortable observation. Most monthly reports signal the wrong things — not through bad data, but through the way they arrive. Specifically, a report that appears eight days after month-end signals that reporting is an afterthought. Furthermore, a summary that says “performance was broadly positive” signals that nobody spent meaningful time thinking about the client’s account. Consequently, clients file those reports away with a vague, nagging sense that something is off — even when the numbers are actually fine.

The problem compounds at scale. Furthermore, when an agency manages fifteen or twenty clients manually, report quality becomes entirely dependent on who had capacity that week. Therefore, one client receives a polished, narrative-rich report. Another receives a table of numbers with a one-sentence summary. Consequently, two clients paying the same retainer have completely different experiences of the same agency — and neither of them knows it.

What clients actually think

“I get a report every month. Most months I look at it, see a bunch of numbers, and genuinely can’t tell if things are going well or not. I have to email them to ask what it means. It makes me feel like I’m not really in the loop — like they know what’s happening but I don’t.”

67%
of clients say they don’t fully understand the monthly reports their agency sends
8 days
Average delay between month-end and report delivery at agencies without automation
Higher trust scores from clients receiving consistent, branded automated reports

What Client Trust Actually Requires From a Report

Specifically, trust in a professional relationship doesn’t build from impressive results alone. Furthermore, it builds from consistent, clear evidence that someone is genuinely paying attention. Therefore, a report that earns trust isn’t necessarily the longest one or the most data-dense one — it’s the one that makes a client feel informed every single month without having to ask for clarification.

Consequently, trust-building reports share four qualities that most manual reports struggle to deliver consistently. Moreover, each one maps directly to something that automated client reporting and white label client reporting solve at the structural level.

Punctuality — same date, every month

Specifically, a report that arrives on the 1st every month without exception signals that the agency runs on systems, not on memory. Furthermore, punctuality is a proxy for reliability — clients extend that inference to everything else the agency does. Consequently, late reports don’t just feel annoying. They feel like evidence of disorganisation.

Clarity — plain English, not platform jargon

Furthermore, clients who need a dictionary to understand their own report don’t feel informed — they feel managed. Specifically, every metric in a trust-building report comes with a plain-English sentence explaining what it means for the business. Therefore, the client reads the report and actually understands it, without a follow-up call to decode it.

Branding — white label quality signals professionalism

Specifically, a polished, consistently branded report carries an implicit message: this agency invests in how it presents itself. Furthermore, clients associate the quality of the document with the quality of the thinking behind it. Moreover, white label client reporting ensures that association always works in the agency’s favour — not the tool’s.

Forward focus — next steps, not just last month

Consequently, a report that ends with “here’s what happened” leaves the client looking backward. Furthermore, one that ends with “here’s what we’re doing about it next month” leaves them looking forward with confidence. Therefore, the forward-looking section transforms a historical document into an active partnership signal.

The Manual Reporting Pain Points That Prevent Consistent Trust

Specifically, every one of those four trust qualities depends on consistency — and consistency is exactly what manual reporting cannot reliably deliver. Furthermore, understanding why requires looking honestly at what manual report production actually involves every month.

1
Data pulling from multiple platforms — every single month

Specifically, GA4, Google Ads, Meta Ads, and Search Console each have different interfaces, different export formats, and different session timeout behaviours. Furthermore, pulling accurate data from all four for one client takes between 45 minutes and two hours. Consequently, with fifteen clients, that’s up to thirty hours of data collection before a single sentence of narrative gets written.

2
Formatting that erases the production time it consumed

Furthermore, raw platform exports look exactly like platform exports — unbranded, inconsistently formatted, and impossible to read without context. Specifically, reformatting tables, rebuilding charts in brand colours, and applying consistent section structure adds another two hours per client. Moreover, the client never sees or appreciates that time — they just see the finished document.

3
Narrative writing at the worst possible moment

Specifically, summaries get written last — after the data pull and the formatting — which means they get written at the point when the account manager has the least energy and time. Consequently, those summaries compress into the vague, generic phrases that clients can’t use: “performance remained broadly stable,” “we saw positive trends in several areas.” Therefore, the most important part of the report gets the least attention.

4
Delivery that depends on human memory

Furthermore, manual reporting relies on someone remembering to send it — on a date that shifts based on the team’s calendar, competing deadlines, and month-end client calls. Consequently, some clients wait eight days. Others wait two weeks. Moreover, nobody flags this as a problem because the report does eventually go out. Therefore, the inconsistency becomes invisible to the agency and very visible to the client.

What Automated Client Reporting Changes — Section by Section

Specifically, automated client reporting doesn’t just save time. Furthermore, it changes the structure of the problem entirely. Consequently, instead of building something every month from scratch, the agency reviews and approves something that already exists — which is a fundamentally different kind of work.

Agency team reviewing automated client reports and white label reporting output showing consistent professional quality

When automated client reporting handles production, account managers review insights rather than build documents — shifting from reactive formatting to proactive client thinking.

Data collection becomes invisible infrastructure

Specifically, automated client reporting connects to GA4, Google Ads, Meta Ads, and Search Console via API. Furthermore, it pulls data on a set schedule — not when someone remembers to log in. Consequently, by the time the account manager opens the draft report, all the data is already there, already compared to the previous month, and already formatted in the standard structure. Moreover, platform authentication failures and rate limit errors are handled automatically — not discovered at 11 PM when the report is due.

Narrative generation becomes a review task, not a blank-page problem

Furthermore, AI-written summaries read the normalised data and produce the first draft of every narrative section — the executive summary, the channel-level explanations, the wins and challenges paragraph. Specifically, these aren’t generic templates with variables swapped in. Consequently, the summary reads the actual numbers, identifies what moved significantly versus the previous month, and explains the movement in plain English. Therefore, the account manager reads a draft and adjusts it — which takes eight minutes instead of forty-five.

White label client reporting makes quality structural, not aspirational

Specifically, white label client reporting configures your branding once — logo, colours, fonts, section structure — and applies it to every report automatically. Furthermore, the fifteenth client report of the month looks as polished as the first. Consequently, quality doesn’t degrade when the team is stretched. Moreover, every client experiences the same standard of presentation regardless of which account manager handles their account. Therefore, your brand promise stays consistent at the exact moment it matters most.

“The report is the only piece of work your client actually sees. Everything else you do is invisible to them. Make the visible thing count.”

The Anatomy of a Report That Actually Builds Trust

Specifically, trust doesn’t build from volume. Furthermore, it doesn’t build from complexity. Consequently, the reports that earn the most client confidence are often the most clearly structured — the ones where every section answers a question the client was already asking.

Automated White Label Report Structure

What every section does for trust
Must Have
Executive Summary — four sentences, plain English

Specifically, this answers the only question every client asks every month: was this a good month or a bad one, and why? Furthermore, it should be the first thing the client reads and the last thing they remember. Consequently, an automated client reporting system generates this from live data — no more blank-page paralysis.

Auto-Generated
Key Metrics Snapshot — four to six numbers with MoM comparison

Furthermore, every metric needs a comparison arrow — up or down from last month. Specifically, a standalone number tells the client nothing. Consequently, automated client reporting applies these comparisons across every metric automatically, removing the formatting step that consumes manual time.

Auto-Generated
Channel Performance — GA4, Google Ads, Meta, Search Console

Specifically, each channel gets its own section with the relevant metrics and a two-to-three sentence plain-English summary. Furthermore, white label client reporting applies your brand colours to every chart in every channel section. Consequently, clients can scan the report and find their channel instantly — because the structure never changes between months.

Must Have
Wins and Challenges — honest, specific, contextualised

Consequently, this is the section most manual reports skip under time pressure. Furthermore, it’s the one that builds the most trust when it’s present and the most doubt when it’s absent. Specifically, automated client reporting generates a draft of this section — and the account manager adds the nuance that only they know from client conversations.

Must Have
Next Month Focus — three specific planned actions

Specifically, “we’ll continue monitoring performance” is not a plan. Furthermore, “we’re pausing the two lowest-performing ad sets, launching two new creative angles, and targeting a 12% CPL reduction” is. Therefore, this section transforms the report from a historical document into a forward-looking partnership signal — and clients notice the difference every time.

How White Label Client Reporting Shapes Brand Perception Over Time

Specifically, brand perception in a service business doesn’t come from a single impressive deliverable. Furthermore, it accumulates through repeated experiences of the same quality, delivered consistently. Consequently, white label client reporting compounds that perception with every reporting cycle — each polished, branded report adding another data point to the client’s assessment of the agency.

Moreover, the brand perception effect has a specific mechanism. Specifically, when a client receives a report with your agency’s full visual identity applied — not a generic export with a logo pasted in the corner — they associate the effort and quality of the document with your agency’s capability. Furthermore, they don’t know how it was produced. Consequently, they judge the finished product against their experience of other agencies they’ve worked with. Therefore, a consistently polished white label report positions your agency as more premium than competitors whose reports look like slightly formatted spreadsheets.

The compounding advantage

Specifically, after twelve months of consistent, polished white label reports arriving on the same date every month, the client has experienced twelve trust deposits. Furthermore, each one has reinforced the same message: this agency is organised, professional, and invested in the relationship. Consequently, when a competitor agency pitches the client, the bar for switching is significantly higher than it would be after twelve inconsistent manual reports. Therefore, automated client reporting and white label delivery together create a competitive moat that campaigns alone never could.

Getting Started Without Disrupting Your Current Process

Specifically, most agencies hesitate to change their reporting process mid-stream because they’re worried about disrupting client relationships. Furthermore, the concern is understandable — but it’s backwards. Consequently, the disruption risk comes from continuing to deliver inconsistent reports, not from improving them.

Start with one client and one reporting cycle

Specifically, connect one client’s data sources, configure your white label template, and run a single automated report alongside the manual one you’d normally build. Furthermore, compare the two. Consequently, the automated version will take roughly fifteen minutes of review time versus four hours of production time — and the quality will be consistent rather than dependent on the team’s bandwidth that week. Therefore, the proof-of-concept is immediate and concrete.

Roll out to your remaining accounts in the following cycle

Specifically, once the template and review process is calibrated on one account, extending it to remaining clients takes a fraction of the original setup time. Furthermore, OAuth connections for each client take ten to fifteen minutes each. Consequently, an agency with twenty clients can be fully automated within a single afternoon — and the first fully automated reporting cycle typically recovers that setup investment within hours.

What agencies report after the first automated cycle: Specifically, the most consistent feedback is surprise — not at the time saved, but at how much better the reports look and read when the production layer is removed from the account manager’s plate. Furthermore, clients notice. Moreover, agencies consistently report fewer “just checking in” emails, more substantive renewal conversations, and a qualitative improvement in how clients describe the relationship. Consequently, the operational fix produces a relationship outcome that goes well beyond what a spreadsheet-and-slides workflow ever achieved.

Build trust with every report — automatically

RaiseReturn connects to GA4, Google Ads, Meta Ads, Search Console, and PageSpeed — and generates fully branded white label client reports with AI-written summaries in under 60 seconds. Same date. Every month. First 30 days completely free, no card required.

Start Your Free Trial →

Common Questions About Automated and White Label Client Reporting

What is automated client reporting and why do agencies need it?
Automated client reporting is the process of using software to pull data from marketing platforms like GA4, Google Ads, Meta Ads, and Search Console automatically — then generating a formatted, narrative-driven report without manual production work. Agencies need it because manual reporting is slow, inconsistent, and consumes hours that should go toward strategy. Automated client reporting ensures every client receives the same quality report on the same date every month, regardless of how busy the team is.
How does white label client reporting benefit a marketing agency?
White label client reporting benefits a marketing agency by ensuring every report carries the agency’s own branding — logo, colours, and design — with no visible trace of the underlying tool. Clients associate the quality and professionalism of the report directly with the agency. Over time, this builds a brand perception that makes the agency harder to replace, because the client’s experience of consistent, polished communication becomes part of what they’re paying for.
What is the difference between automated client reporting and a live dashboard?
A live dashboard shows real-time numbers without context or narrative. Automated client reporting takes that same data on a set schedule, adds AI-written plain-English summaries explaining what happened and why, applies branded white label formatting, and delivers the finished report to the client automatically. Dashboards answer what is happening right now. Automated client reports answer what happened, what it means, and what the agency is doing about it.
How often should agencies send automated client reports?
Most agencies send automated client reports monthly — on a fixed date that clients can rely on. Monthly reporting gives campaigns enough time to show meaningful trends without leaving clients uninformed for too long. The fixed date matters as much as the frequency: a report that arrives on the 1st of every month without fail signals reliability far more powerfully than one that arrives “sometime in the first week” depending on team capacity.

Specifically, the agencies that clients remember — the ones they stay with for three and four years, the ones they refer colleagues to — aren’t always the ones with the highest ROAS. Furthermore, they’re the ones whose clients felt genuinely looked after every single month. Consequently, that feeling doesn’t come from campaigns. It comes from the report that lands in the inbox on the 1st, looks exactly right, and says exactly what the client needed to hear.

Build that report automatically. Deliver it flawlessly. Watch what happens to retention.

Marketing Automation and Google Analytics: The Combination Most Marketers Get Wrong

Here’s a scenario that plays out inside almost every marketing team, every single month. The automation platform sends a performance summary — open rates, click rates, sequences completed, leads generated. Separately, Google Analytics shows traffic, conversions, and revenue. Neither report talks to the other. Consequently, nobody actually knows whether the marketing automation is making money.

That’s not a data problem. It’s a connection problem.

Furthermore, marketing automation and Google Analytics are two halves of the same answer. Specifically, your automation platform knows what it sent and who clicked. However, Google Analytics knows what those people did after they clicked — which pages they visited, how long they stayed, and whether they converted. Therefore, treating these as separate tools produces reports that are individually impressive and collectively useless.

The Expensive Disconnect Most Teams Live With

Specifically, most marketers check their automation platform dashboard and their Google Analytics reports in different tabs on different days. Furthermore, they summarise both in the same monthly report without ever connecting them. Consequently, they end up with a situation where the automation says “great open rates” and Google Analytics says “not much revenue from email” — and nobody resolves the contradiction.

The contradiction is resolvable. It just requires setting up the connection properly, which most teams never do because nobody specifically owns both tools at once.

A real conversation

“Our email automation has a 34% open rate and a 6% click rate. We’re thrilled with it.” Meanwhile, GA4 shows email drives 2% of their revenue. Those numbers don’t conflict — they just reveal that people are clicking and then leaving immediately. The automation is performing. The landing experience isn’t. However, they never knew that because the two data sources never spoke to each other.

76%
of marketers say they can’t accurately attribute revenue to specific automated campaigns
higher revenue per email when automation is properly connected to Google Analytics data
18%
of email traffic shows as Direct in GA4 due to missing UTM parameters

How Marketing Automation and Google Analytics Actually Work Together

Specifically, marketing automation handles the send side — the emails, the triggered sequences, the lead nurturing flows, the re-engagement campaigns. Furthermore, Google Analytics handles the receive side — what happens to people after they arrive on your website from one of those sends.

Therefore, a properly connected setup creates a feedback loop. Specifically, Google Analytics tells your automation platform which leads are actually converting, which pages are closing deals, and which sequences are producing visitors who bounce immediately. Consequently, your automation team uses that data to improve sequences, change timing, and prioritise the messages that actually drive revenue.

1
Automation sends

Email sequence fires with UTM-tagged links to landing pages

2
GA4 tracks

Google Analytics records the session, behaviour, and conversion outcome

3
Revenue attributed

GA4 connects the email touchpoint to the purchase or conversion event

4
Strategy improves

Automation sequences update based on what GA4 shows actually converts

However, this loop only works when the two tools actually talk to each other. Specifically, the link between them is UTM parameters — and most automation platforms let you set these once per campaign template and then forget about them. Consequently, every email that goes out automatically carries the tracking tags GA4 needs to attribute revenue correctly.

UTM Parameters — The Bridge Between Automation and GA4

If you’ve never set up UTM parameters properly, this is the single highest-leverage thing you can do this week. Specifically, UTM parameters are short tags you add to the end of any link in your automated emails. Furthermore, Google Analytics reads those tags and uses them to classify the traffic source, medium, and campaign name for every session that arrives.

Without UTM parameters, Google Analytics has no way to know a visitor came from your automated email sequence. Consequently, it either classifies them as Direct traffic or misattributes them to a different channel entirely. Therefore, your automation platform shows strong click data while GA4 shows almost nothing from email — and both are technically correct.

UTM Parameter What it tracks Example value
utm_sourceWhere the traffic came frommailchimp / klaviyo / hubspot
utm_mediumThe type of channelemail
utm_campaignThe specific campaign namemay-nurture-sequence
utm_contentWhich link inside the emailcta-button / hero-image
utm_termKeyword or audience segmenttrial-users / cold-leads

Specifically, most automation platforms let you set campaign-level UTM parameters once in the settings — and every link in that campaign automatically inherits them. Furthermore, some platforms like Klaviyo, HubSpot, and ActiveCampaign even have native Google Analytics integration that does this automatically. Therefore, the setup takes about fifteen minutes per campaign and pays back in attribution clarity every single month after that.

Setting Up GA4 Conversion Events for Automation Funnels

UTM parameters tell GA4 where visitors came from. However, conversion events tell it what those visitors did. Furthermore, without conversion events set up correctly in GA4, you can track that an email sequence drove traffic — but you can’t track whether that traffic actually completed anything meaningful.

Specifically, GA4 lets you mark any event as a conversion — a form submission, a purchase, a booking, a free trial signup, a page view on a thank-you URL. Therefore, every meaningful action in your automation funnel should have a corresponding GA4 conversion event.
Google Analytics GA4 dashboard showing marketing automation campaign conversion tracking and revenue attribution

When GA4 conversion events map to your automation funnel stages, you can see exactly which sequences drive the most revenue — not just the most clicks.

The automation funnel events you should track in GA4

Specifically, map your automation funnel stages to GA4 events, and mark each one as a conversion:

  • Lead magnet download — tracks top-of-funnel entry into your automation sequence
  • Free trial signup — tracks when automation converts a prospect to an active user
  • Demo booked — tracks sales intent signals generated by nurture sequences
  • Purchase completed — the revenue event that closes the attribution loop
  • Subscription renewed — tracks long-term revenue influenced by retention automation

Furthermore, once these events are live in GA4, you can filter your Traffic Acquisition report to the email channel and see exactly how much revenue your marketing automation drove — broken down by campaign, by sequence, and by individual email. Consequently, the “which automation is actually working” question gets a concrete, data-backed answer instead of a gut feeling.

“Marketing automation without Google Analytics attribution is like running a restaurant where you track how many people read the menu but never check how many ordered food.”

Using GA4 Audiences to Power Smarter Automation

Specifically, this is where the relationship between marketing automation and Google Analytics gets genuinely powerful — and where most teams leave the most value on the table. Furthermore, GA4 lets you build audiences based on website behaviour, and those audiences can feed directly into your automation triggers.

Specifically, consider what you can do with GA4 audience data in your automation platform. Here are the most effective combinations:

Trigger sequences based on page behaviour

Specifically, create a GA4 audience of users who visited your pricing page more than twice in seven days without converting. Furthermore, export that audience to Google Ads and use it to trigger a remarketing sequence specifically for high-intent visitors who didn’t quite tip over. Consequently, your automation responds to real buying signals rather than arbitrary timing rules.

Suppress automation for converted users

Specifically, build a GA4 audience of users who completed a purchase event in the last 30 days. Furthermore, use that audience to suppress those users from receiving acquisition-focused automation sequences. Consequently, you stop sending “have you considered buying?” emails to people who already bought — which, embarrassingly, happens constantly in teams that don’t connect these two tools.

Re-engage based on engagement drop-off

Specifically, create a GA4 audience of users who visited the site regularly for 60 days and then stopped. Furthermore, feed that audience into a re-engagement automation sequence. Therefore, your marketing automation responds to actual disengagement signals from the data — not just the absence of an email open.

The GA4 → automation feedback loop in practice

Specifically, GA4 tells you who is engaged, who converted, and who disappeared. Furthermore, your automation platform acts on each of those signals with targeted, timed messaging. Therefore, instead of sending the same sequence to your entire list, you send the right message to the right person based on what they’ve actually done on your site. Consequently, conversion rates improve without requiring more leads — just smarter segmentation.

Why Your Marketing Automation Reports Need GA4 Data Inside Them

Specifically, most marketing automation platforms produce their own reports — open rates, click rates, unsubscribe rates, sequence completion rates. Furthermore, those reports are useful but incomplete. However, they only tell you what happened inside the email. Consequently, they miss everything that matters most — what happened after the click.

Therefore, a genuinely complete marketing automation report needs Google Analytics data alongside the email platform data. Specifically, that means showing, for each campaign: emails sent, clicks, click rate, GA4 sessions from that campaign, GA4 conversions from those sessions, and revenue attributed. Furthermore, with that full picture, you can see which campaigns are driving high click rates but low conversion — which usually means strong subject lines but weak landing pages — versus which campaigns drive lower clicks but high revenue per click.

What this looks like in a real report: Campaign A — 2,400 emails, 6.2% CTR, 149 clicks, 8 conversions, $4,800 revenue. Campaign B — 2,400 emails, 4.1% CTR, 98 clicks, 14 conversions, $8,400 revenue. Furthermore, Campaign B looks weaker on email metrics. However, it drives nearly twice the revenue per email sent. Consequently, that’s where you put more budget and more creative attention — and you’d never know it without the GA4 attribution layer.

How Automated Client Reporting Ties This Together

Specifically, if you’re an agency managing marketing automation for clients, the reporting challenge doubles. Furthermore, you need to pull data from the automation platform and from Google Analytics and present both coherently in a client report that a non-technical business owner can actually understand.

Consequently, most agencies handle this by manually exporting from both platforms, stitching the data together in a spreadsheet, and writing a summary paragraph that tries to connect the dots. Moreover, that process takes hours per client and still often produces reports where the email metrics and the GA4 data sit in separate sections with no connection drawn between them.

RaiseReturn pulls GA4 data automatically and structures it alongside your other channel data — all in one branded, AI-written report that ties the story together. Furthermore, your account managers review the draft instead of building it from scratch. Therefore, the complete marketing automation picture — what the automation sent, what GA4 measured, and what the revenue outcome was — appears in one coherent document, every month, automatically.

Connect your marketing automation data with GA4 — automatically

RaiseReturn pulls GA4, Google Ads, Meta Ads, Search Console, and PageSpeed into one branded, AI-written client report in under 60 seconds. Give every client the full marketing automation picture — not just the email metrics. First 30 days free.

Start Your Free Trial →

Five Marketing Automation Mistakes That Google Analytics Exposes

Specifically, once you properly connect marketing automation to Google Analytics, some uncomfortable truths tend to surface. Furthermore, here are the five most common ones — and what to do about each.

Missing UTM parameters on all automated links

Specifically, all your email clicks show as Direct traffic in GA4. Furthermore, this makes your automation look invisible in the data. Therefore, audit your automation templates and add UTM parameters to every link before the next send cycle.

No conversion events for automation funnel stages

Consequently, you track clicks but not outcomes. Furthermore, GA4 can’t show which sequences drive revenue without conversion events mapped to each funnel stage. Therefore, set up events for every meaningful action in your automation flow.

Sending converted customers acquisition sequences

Specifically, this happens when your CRM and GA4 don’t share audience data. Furthermore, it damages trust and inflates unsubscribe rates. Therefore, build a GA4 audience of recent converters and suppress them from top-of-funnel sequences immediately.

Optimising for email opens instead of revenue

Specifically, open rate is a vanity metric without GA4 revenue attribution alongside it. Furthermore, an email with a 40% open rate and a 0.3% conversion rate is not a success. Therefore, always evaluate automation performance with GA4 revenue data, not email platform metrics alone.

Never updating sequences based on GA4 behaviour data

Consequently, automation becomes stale. Furthermore, most teams set up sequences once and leave them running indefinitely. Therefore, review GA4 attribution data quarterly and update sequences where click-to-conversion rates have dropped below your target threshold.

Common Questions About Marketing Automation and Google Analytics

How do marketing automation and Google Analytics work together?
Marketing automation handles the actions — sending emails, triggering sequences, moving leads through funnels. Google Analytics tracks the behaviour that happens as a result — which pages people visit, which goals they complete, where they drop off. When you connect both properly via UTM parameters and GA4 conversion events, your automation sequences can respond to what Google Analytics tells you about user behaviour, and your GA4 reporting shows exactly which automated sequences drive the most revenue.
What is the best way to use Google Analytics for marketing automation?
The best way to use Google Analytics for marketing automation is to set up GA4 conversion events for every meaningful action in your funnel, use UTM parameters consistently on every automated email and campaign link, and create GA4 audiences based on user behaviour that feed back into your automation platform. This creates a closed loop where Google Analytics informs your automation strategy and your automation drives the conversions GA4 tracks.
What are UTM parameters and why do they matter for marketing automation?
UTM parameters are tracking tags you add to links in your automated emails and campaigns that tell Google Analytics exactly where each visitor came from. Without them, GA4 shows visitors from your email sequences as Direct traffic — meaning you lose all attribution for your automation performance. With UTM parameters properly configured, you can see in GA4 exactly how many conversions and how much revenue each automated campaign drove.
How do I track marketing automation results in Google Analytics?
To track marketing automation results in Google Analytics, add UTM parameters to every link in your automated emails and sequences, set up GA4 conversion events for your key actions (purchases, form completions, bookings), and use the Traffic Acquisition report in GA4 filtered to the email channel to see the full performance picture. Then include this data in your client reports alongside your automation platform metrics to show exactly which touchpoints drive the most revenue.

Specifically, marketing automation and Google Analytics aren’t two separate tools competing for your attention. Furthermore, they’re two parts of one system — and the system only works when both parts connect. Therefore, the next time your automation platform reports strong engagement while GA4 shows flat revenue, don’t dismiss the contradiction.

Follow it. That’s where the money is hiding.

How to Automate Client Reports: The Complete Technical Guide (2026)

Every agency wants to know how to automate client reports. Most of them have already Googled it. Consequently, they find a listicle of tools, spend forty minutes comparing pricing pages, pick one that looks fine, and then discover it doesn’t actually connect to all their data sources. Sound familiar?

Let’s skip that loop.

Furthermore, I’ve spent 22 years building the underlying infrastructure that makes automated client reports actually work — the API connections, the data normalisation layer, the rendering pipeline, the delivery scheduling. Specifically, I built RaiseReturn because every existing solution I found handled one or two of those pieces well and left the rest to manual effort. Therefore, this guide covers the whole thing — from why manual reporting breaks to exactly how automation fixes every layer of the problem.

Why Manual Client Reporting Always Eventually Breaks

Specifically, manual reporting has four failure points. Furthermore, each one compounds the others. Therefore, understanding them is the fastest way to see why a partial fix doesn’t work.

The data pull problem. GA4’s interface changes without warning. Meta Business Suite requires re-authentication roughly every 60 days per account. Google Ads exports default to date ranges that aren’t what you actually wanted. Consequently, pulling accurate data from four platforms manually for ten clients takes somewhere between two and four hours every month — per account manager.

The formatting problem. Raw exports look terrible. Furthermore, they need resizing, recolouring, brand application, and chart rebuilding. Moreover, none of that work requires expertise — it just requires time. Consequently, your most expensive people spend hours doing work any competent piece of software could handle in seconds.

Founder’s note

“I once clocked myself doing a full manual reporting cycle for one client — GA4, Google Ads, Meta, Search Console combined, formatted in slides. Four hours and eleven minutes. Furthermore, that was me, someone who built the software that now does it automatically. Consequently, I understood exactly what we were solving when we built RaiseReturn.”

5h
Average manual report build time per client per month
40%
of an AM’s working month consumed by reporting at a 10-client agency
60s
Time to generate a complete automated report with RaiseReturn

Step 1 — Connect the Data Sources via API

Specifically, the foundation of any automated client reporting system is reliable API connections. Furthermore, you need five of them to cover the main channels most marketing agencies manage.

Google Analytics Data API (GA4)

Pulls sessions, conversions, revenue, and channel breakdown. Requires OAuth 2.0 per property. Furthermore, the runReport endpoint handles most use cases cleanly.

OAuth 2.0 required
Google Ads API

Pulls spend, impressions, clicks, conversions, and ROAS. However, it requires a developer token — which Google approves separately from OAuth. Consequently, this is the slowest of the five to get live.

Developer token needed
Meta Marketing API

Pulls spend, reach, results, CPL, and ROAS across Facebook and Instagram. Furthermore, tokens expire every 60 days by default — so build automatic refresh into your auth layer from day one.

Token refresh critical
Google Search Console API

Pulls clicks, impressions, CTR, and average position by query and page. Specifically, use the searchAnalytics.query method with site: verification already confirmed for the client domain.

Site verification required

Specifically, each API uses OAuth 2.0 — which means you authenticate once per client account, store the refresh token securely, and your system handles re-authentication automatically when access tokens expire. Furthermore, this is where most DIY automations break. Consequently, token management at scale across dozens of client accounts requires a proper secrets management layer, not just a spreadsheet of credentials.

Step 2 — Normalise the Data Into a Consistent Structure

Here’s where most DIY automation falls apart. Specifically, each platform returns data in a completely different shape. Furthermore, GA4 calls it “sessions” while Google Ads calls similar concepts “visits” — and Meta calls nothing the same as anyone else. Consequently, you need a normalisation layer that translates every platform’s output into a consistent internal schema before you touch the report template.

Automated client reporting pipeline showing normalised data flowing from multiple marketing platforms into unified report output

A proper automated report pipeline normalises data from five different platforms into one consistent structure before building the report output.

Furthermore, this schema works as the single source of truth for everything downstream — the report template, the AI summary generator, and the delivery scheduler all read from it. Therefore, if a platform API fails during a pull, the system flags it at this layer rather than silently generating a report with missing data.

Step 3 — Generate the Narrative With AI

Raw data without context is just noise. Consequently, the narrative layer is what transforms a data dump into an actual client report. Furthermore, this is where AI earns its place in the pipeline.

Specifically, the AI reads the normalised data schema, identifies the notable movements — things that changed more than a threshold percentage, metrics that beat or missed targets, channels that significantly outperformed or underperformed — and writes a plain-English explanation of each.

Specifically, the same approach generates summaries for each channel section — a paragraph for GA4, one for Google Ads, one for Meta. Furthermore, the account manager reviews and edits these before delivery. Moreover, they’re not replacing human judgment — they’re replacing the blank-page problem that burns time when someone sits down to write four summaries from scratch at 10 PM.

“The AI doesn’t write the report. It writes the first draft. The account manager still adds the strategic layer — they just skip the four hours of staring at a blank paragraph.”

Step 4 — Render the Report With Consistent Branding

Specifically, the rendering layer takes the normalised data and the AI summaries and builds the actual PDF or Google Sheets output. Furthermore, this is where branding lives — logo, colours, fonts, section headers, cover page.

Consequently, every report your agency sends looks like it was built specifically for that client, by that agency. Moreover, there’s no visible trace of the underlying tool — no watermarks, no platform footers, no generic template headers. Therefore, clients associate the quality of the report entirely with your agency, which is exactly where that association belongs.

Why consistent branding matters technically

Specifically, white-label rendering means configuring a template engine — we use a combination of server-side rendering and PDF generation — that accepts dynamic values from the data schema and applies them inside a locked brand structure. Furthermore, the account manager sets brand variables once per client: logo URL, primary colour, secondary colour, and font choice. Consequently, every subsequent report inherits those settings automatically without any production work.

Step 5 — Schedule and Deliver Automatically

Specifically, this is the step that most agencies underestimate. Furthermore, generating a report is not the same as delivering it reliably. Therefore, the delivery layer needs to handle three things independently.

1

Scheduled generation — not manual triggers

Specifically, the report generation should fire on a cron schedule, not when someone remembers to click a button. Furthermore, you set the schedule once — “first of every month at 7 AM” — and the system handles everything after that automatically.

2

Pre-delivery human review window

Specifically, build a 24-hour review window between generation and delivery. Furthermore, the account manager receives a notification, opens the draft, reviews the AI summaries, makes any adjustments, and approves. Consequently, clients receive a human-reviewed report — not a raw machine output.

3

Multi-format delivery

Specifically, some clients want a PDF attachment. Furthermore, others want a Google Sheets link they can dig into themselves. Moreover, some want both. Therefore, the delivery layer should support all three without requiring the account manager to rebuild anything.

What this looks like in practice with RaiseReturn: You connect a client’s accounts once. You configure the template and delivery schedule. After that, a draft report lands in your review queue on the 29th of every month. You review it in 15 minutes, click approve, and the client receives a polished, branded report on the 1st — without anyone manually pulling a single piece of data.

The Failure Points DIY Automations Always Hit

Specifically, I’ve watched dozens of agencies try to build this pipeline themselves before eventually using RaiseReturn. Furthermore, they almost always hit the same three walls in the same order.

OAuth token management at scale

Specifically, managing refresh tokens for one client account is straightforward. However, managing them for 20 or 30 clients across five platforms, where each token has a different expiry cycle and different failure modes, requires a proper secrets vault and retry logic that most in-house builds underinvest in. Consequently, reports start silently failing — generating with missing data — and nobody notices until a client asks why their Meta numbers aren’t in this month’s report.

API rate limits hitting unexpectedly

Furthermore, Google Ads has a daily operations quota. Meta’s Marketing API rate limits per app per hour. Specifically, when you run 20 client reports simultaneously — all pulling from the same app credentials — you hit those limits fast. Therefore, a proper automation layer needs exponential backoff, request queuing, and retry logic built in from the start, not bolted on after the first rate limit panic.

The data schema drifts

Specifically, Meta renamed several API fields in 2024. GA4 deprecated a metric that a lot of reports relied on. Consequently, DIY pipelines that hardcoded those field names started returning null values — silently — until someone noticed the zeros in the report. Therefore, building a maintenance layer into any automated client reporting system isn’t optional. It’s the hidden ongoing cost that most agencies underestimate.

The build-vs-buy calculation: Specifically, building a robust automated client reporting pipeline from scratch takes an experienced developer roughly three to four months of full-time work. Furthermore, maintaining it across API changes, platform deprecations, and new client requirements adds another two to four hours per week indefinitely. Therefore, the build-vs-buy case for a purpose-built tool like RaiseReturn typically resolves in favour of the tool within the first six months — and that’s before counting the developer’s opportunity cost.

How RaiseReturn Handles Every Layer

Specifically, we built RaiseReturn because we got tired of watching agencies solve the same pipeline problems from scratch — badly. Furthermore, every component described in this guide — OAuth management, data normalisation, AI summaries, branded rendering, scheduled delivery — runs inside RaiseReturn already.

Consequently, the agency’s setup process looks like this:

  • Connect client accounts via guided OAuth flows — GA4, Google Ads, Meta Ads, Search Console, PageSpeed
  • Upload your agency logo and set brand colours — done once, inherited by every report
  • Configure which sections to include per client — not every client needs every channel
  • Set your delivery schedule — “first of the month, 7 AM, PDF to this email address”
  • Review the AI-written draft on the 29th — 10 to 15 minutes per client
  • Approve and the report lands in the client’s inbox automatically

Furthermore, no code required. No developer on retainer. Moreover, no maintenance overhead when Meta changes an API field, because we handle that at the infrastructure layer. Consequently, your account managers spend 15 minutes reviewing instead of five hours producing.

Stop building this yourself

RaiseReturn handles every layer — OAuth connections, data normalisation, AI summaries, branded PDF rendering, and scheduled delivery — in under 60 seconds per client. First 30 days completely free, no card required.

Start Your Free Trial →

Frequently Asked Questions About Automating Client Reports

How do I automate client reports for a marketing agency?
To automate client reports for a marketing agency, you need to connect to your data sources (GA4, Google Ads, Meta Ads, Search Console) via API, normalise the data into a consistent structure, apply branded formatting, generate AI-written narrative summaries, and schedule automatic delivery. Tools like RaiseReturn handle the entire pipeline — from API authentication to branded PDF delivery — in under 60 seconds per client.
What APIs do you need to automate client reports?
To automate client reports covering the main marketing channels, you need the Google Analytics Data API (GA4), Google Ads API, Meta Marketing API, Google Search Console API, and optionally the PageSpeed Insights API. Each requires OAuth 2.0 authentication per client account. The main technical challenge is maintaining token refresh cycles and handling rate limits across all five simultaneously at scale.
How long does it take to set up automated client reports?
With a purpose-built tool like RaiseReturn, you can set up automated client reports for one client in a single afternoon — connecting data sources, configuring the branded template, and scheduling delivery. The setup investment is recovered within the first reporting cycle, when the tool generates in 60 seconds what previously took five hours to build manually.
What is the difference between a dashboard and an automated client report?
A dashboard shows live numbers without narrative context. An automated client report pulls that same data on a schedule, formats it professionally, adds AI-written plain-English summaries explaining what happened and why, and delivers it to the client automatically. Dashboards answer “what is happening right now.” Automated client reports answer “what happened, why it happened, and what we’re doing next.”
Can I automate client reports without coding?
Yes. Tools like RaiseReturn handle all the API connections, data normalisation, and report generation without requiring any coding from the agency. You connect your client accounts through a guided OAuth flow, configure your branded template, set a delivery schedule, and the system handles everything automatically. The AI-written summaries are ready for a 10–15 minute human review before sending.

Specifically, automating client reports isn’t magic. Furthermore, it’s five clearly defined engineering problems — API connections, data normalisation, AI narrative generation, branded rendering, and scheduled delivery. Therefore, each layer has a solution. Moreover, you can build each one yourself or use a platform that has already solved them.

Either way, the manual alternative gets more expensive every month you wait.

What a Monthly Performance Report Should Actually Look Like (Not the Garbage Most Agencies Send)

I’ve personally looked at over a thousand monthly performance reports. Maybe more. Furthermore, the majority of them have the same problem — they’re not built to be read, they’re built to be sent.

There’s a difference. A big one.

A report built to be sent exists to check a box. It gets exported from GA4, pasted into a slide deck, and shipped off at 11 PM with a one-line summary nobody spent more than ninety seconds writing. However, a report built to be read does something completely different — it tells the client a story they actually want to follow.

Furthermore, I’ve spent two decades building data pipelines for marketing platforms, and the technical side of this is genuinely the easy part. Specifically, GA4’s API isn’t that complicated once you’ve fought with its quirks a few hundred times. Consequently, the hard part was never pulling the data. It was figuring out what to actually do with it once you had it.

Why Most Monthly Performance Reports Are Genuinely Bad

Let me describe the typical monthly performance report, because I think most agency owners have stopped seeing how bad theirs actually is. Specifically, page one is a wall of GA4 metrics with zero context. Furthermore, page three is a Google Ads table with twelve columns nobody asked for. Moreover, the summary paragraph reads like it was written by someone checking the clock, not someone who cares.

Here’s the thing. None of this happens because account managers are lazy. Therefore, it happens because manually pulling data from GA4, Meta, and Search Console is genuinely exhausting work. Specifically, GA4’s interface alone can eat forty-five minutes per client if you’re hunting for the right date comparison view.

Founder’s note

“I once timed myself manually building one client’s monthly report from scratch — GA4, Google Ads, Meta, and Search Console combined. Four hours and twenty minutes. Furthermore, that’s just the data collection and formatting. The actual writing came after. Consequently, I understood viscerally why every account manager I’ve ever met hates the last week of every month.”

67%
of clients say they don’t fully understand their monthly performance report
5h
Average time spent building one monthly performance report manually
60s
Time to generate a complete report automatically with RaiseReturn

The Anatomy of a Monthly Performance Report That Actually Works

Specifically, here’s the structure I’ve watched succeed across hundreds of agency accounts. Furthermore, it’s not complicated. It’s just intentional — every section earns its place.

Clean monthly performance report layout showing GA4 Google Ads and Meta Ads performance data clearly

A well-structured monthly performance report guides the reader through a story — not just a stack of numbers from each platform.

1
Executive Summary — Four Sentences Maximum

Specifically, this section answers one question: was this a good month or a bad one, and why? Furthermore, it should mention the headline number, what drove it, and what to watch going forward. Therefore, a client who reads only this paragraph should still understand the state of their account.

2
Key Metrics Snapshot With MoM Comparisons

Specifically, pick four to six numbers that matter most for this client’s goals. Furthermore, every number needs a month-over-month comparison arrow. Consequently, a single number without context — “312 leads” — tells the reader almost nothing useful on its own.

3
Channel Performance — GA4, Google Ads, Meta, GSC

Specifically, each channel gets its own short section with the relevant metrics and two to three sentences explaining the story. Furthermore, this is where you translate platform jargon into plain English. Moreover, nobody outside the industry knows what a “thumb stop rate” is, so explain it inline.

4
Wins and Challenges — Honestly Stated

Specifically, call out genuine wins with evidence attached. Furthermore, be direct about what didn’t go well and why. Therefore, clients trust agencies that explain a rough patch clearly far more than agencies that quietly bury it inside a vague sentence about “market conditions.”

5
Next Month Focus — Three Specific Actions

Specifically, this is the most underrated section in any monthly performance report. Furthermore, it transforms a backward-looking document into one with momentum. Consequently, clients who see a clear plan ahead don’t spend the next month wondering whether their agency is actually thinking strategically.

What Good vs Bad Actually Sounds Like

Specifically, here’s the difference in practice. Furthermore, the data underneath each example below is identical. Therefore, the only thing that changed is the writing.

The Lazy Version

“Meta performance was broadly in line with expectations this period. Several campaigns showed positive trends while others faced challenges consistent with seasonal patterns.”

The Real Version

“Meta CPL rose 24% in May, driven by increased competitor spend ahead of summer. We’ve paused three underperforming ad sets and launched two new creative angles — expecting CPL to normalise by late June.”

Specifically, the second version costs maybe ninety more seconds to write. However, it builds significantly more trust. Consequently, that ninety seconds is one of the highest-leverage things any account manager does all month.

“A monthly performance report isn’t a data dump. It’s a confidence-building document. Write it like someone is actually going to read it — because someone is.”

How I Built the Pipeline That Automates This Entirely

Furthermore, let me get specific about the engineering side, because I think this is genuinely interesting if you’ve ever wrestled with these APIs yourself.

Specifically, RaiseReturn connects to GA4, Google Ads, Meta Ads, Search Console, and PageSpeed using OAuth 2.0 authentication per client. Furthermore, each platform’s reporting API gets queried on a schedule, normalised into a common data structure, and dropped into the report engine.

Consequently, the system handles rate limits, token refreshes, and platform-specific data quirks automatically. Therefore, the account manager never touches any of that complexity. Moreover, they receive a finished report with an AI-written first draft of every narrative section, ready for a quick review.

What Changes Once the Report Builds Itself

Specifically, the shift isn’t just about time saved, although that’s significant. Furthermore, it’s about what account managers do with the time they get back.

Consequently, instead of spending four hours formatting tables, they spend fifteen minutes reading the AI-generated draft and adding genuine insight. Therefore, the monthly performance report stops being a chore and starts being a genuine touchpoint — one where the account manager’s actual expertise shows up clearly, rather than getting buried under spreadsheet work.

Real outcome: Agencies using RaiseReturn typically cut monthly reporting time by 80% or more. Furthermore, report quality improves because the time saved goes directly into the writing and strategic commentary — the part clients actually read and remember.

Three Mistakes I Still See Constantly

Leading with vanity metrics

Specifically, impressions and reach numbers look impressive but rarely connect to business outcomes. Furthermore, lead with conversions, revenue, or whatever metric actually maps to the client’s goals. Therefore, save the vanity metrics for a supporting role, if you include them at all.

Skipping the comparison

Specifically, a number without a month-over-month comparison is just a number floating in space. Furthermore, every key metric needs context against last month — and ideally last year too, if seasonality matters for that business.

Forgetting the next steps section

Specifically, this is the section most agencies skip when they’re rushing at month-end. However, it’s the one that makes a monthly performance report feel forward-looking instead of purely historical. Therefore, never send a report without it.

Watch out for this: A monthly performance report that only looks backward leaves clients wondering what happens next. Specifically, three bullet points about next month’s focus costs almost nothing to write but changes how the entire report feels to read.

Build this exact report structure automatically

RaiseReturn connects to GA4, Google Ads, Meta Ads, GSC, and PageSpeed — and generates a fully branded monthly performance report with AI-written summaries in under 60 seconds. First 30 days free, no card required.

Start Your Free Trial →

Common Questions About Monthly Performance Reports

What should a monthly performance report include?
A strong monthly performance report should include a one-paragraph executive summary in plain English, a key metrics snapshot with month-over-month comparisons, channel-level performance for GA4, Google Ads, Meta Ads, and Search Console, an honest wins-and-challenges breakdown, and a next-month focus section with specific planned actions. Every section should explain what happened and why — not just display raw numbers.
How long should a monthly performance report be?
A monthly performance report should take a reader under ten minutes to fully understand. For most clients, that means six to ten pages covering the key channels they care about. Length should follow clarity, not the other way around — padding a report with extra metrics nobody reads makes it worse, not more thorough.
What is the difference between a dashboard and a monthly performance report?
A dashboard shows live, real-time numbers without narrative context. A monthly performance report adds the story behind those numbers — what changed, why it changed, and what the agency is doing about it. Dashboards answer “what is happening right now.” Monthly performance reports answer “what happened, why, and what’s next,” which is what most clients actually want to understand.
How can I automate my monthly performance report?
To automate a monthly performance report, connect a tool like RaiseReturn to GA4, Google Ads, Meta Ads, Search Console, and PageSpeed via API. The tool pulls live data on a set schedule, applies your branding automatically, and generates an AI-written narrative summary in under 60 seconds. The account manager then reviews the output for roughly 15 minutes before sending — instead of building the entire report manually.

Specifically, the agencies that win long-term retainers aren’t the ones with the fanciest dashboards. Furthermore, they’re the ones whose reports actually get read, understood, and trusted every single month.

Build it properly once. Automate it forever after.